Crude Oil recedes further, WTI falls below $78 on rising supplies and cautious FOMC

Source Fxstreet
  • WTI declines for a third straight day on Wednesday.
  • US barrel counts hint at further supply overhang.
  • FOMC Meeting Minutes reveal cautious Fed, rate hopes stumble.

West Texas Intermediate (WTI) US Crude Oil declined for a third straight day on Wednesday, falling below $78.00 per barrel once again after US Crude Oil barrel counts rose week-on-week after a previous decline. The Federal Reserve’s (Fed) latest Meeting Minutes revealed the Federal Open Market Committee (FOMC) remains stubbornly committed to waiting for firmer signs that US inflation will continue easing towards the Fed’s 2% annual target, vexing rate cut hopes and knocking risk sentiment lower in the midweek market session.

Read more: Fed Minutes leave the door open to a probable rate cut in September

According to the Energy Information Administration (EIA), US Crude Oil Stocks through the week ended May 17, climbing 1.825 million barrels, well above the median market forecast of a -3.1 million barrel decline. The week-on-week EIA barrel count chewed through most of the previous week’s -2.508 million barrel drop, reigniting concerns that US Crude Oil production threatens to swamp demand.

Crude Oil over-production concerns rose further on Wednesday after Russia announced an accidental overproduction of Russian Crude, with the nation pointing a finger at “technical difficulties”. According to sources, Russia’s Energy Minister will be putting options for voluntary output cuts “under review. Russia is expected to present a plan to offset additional production to OPEC , the extended group of associate states aligned with the inner core of the Organization of the Petroleum Exporting Countries (OPEC).

WTI technical outlook

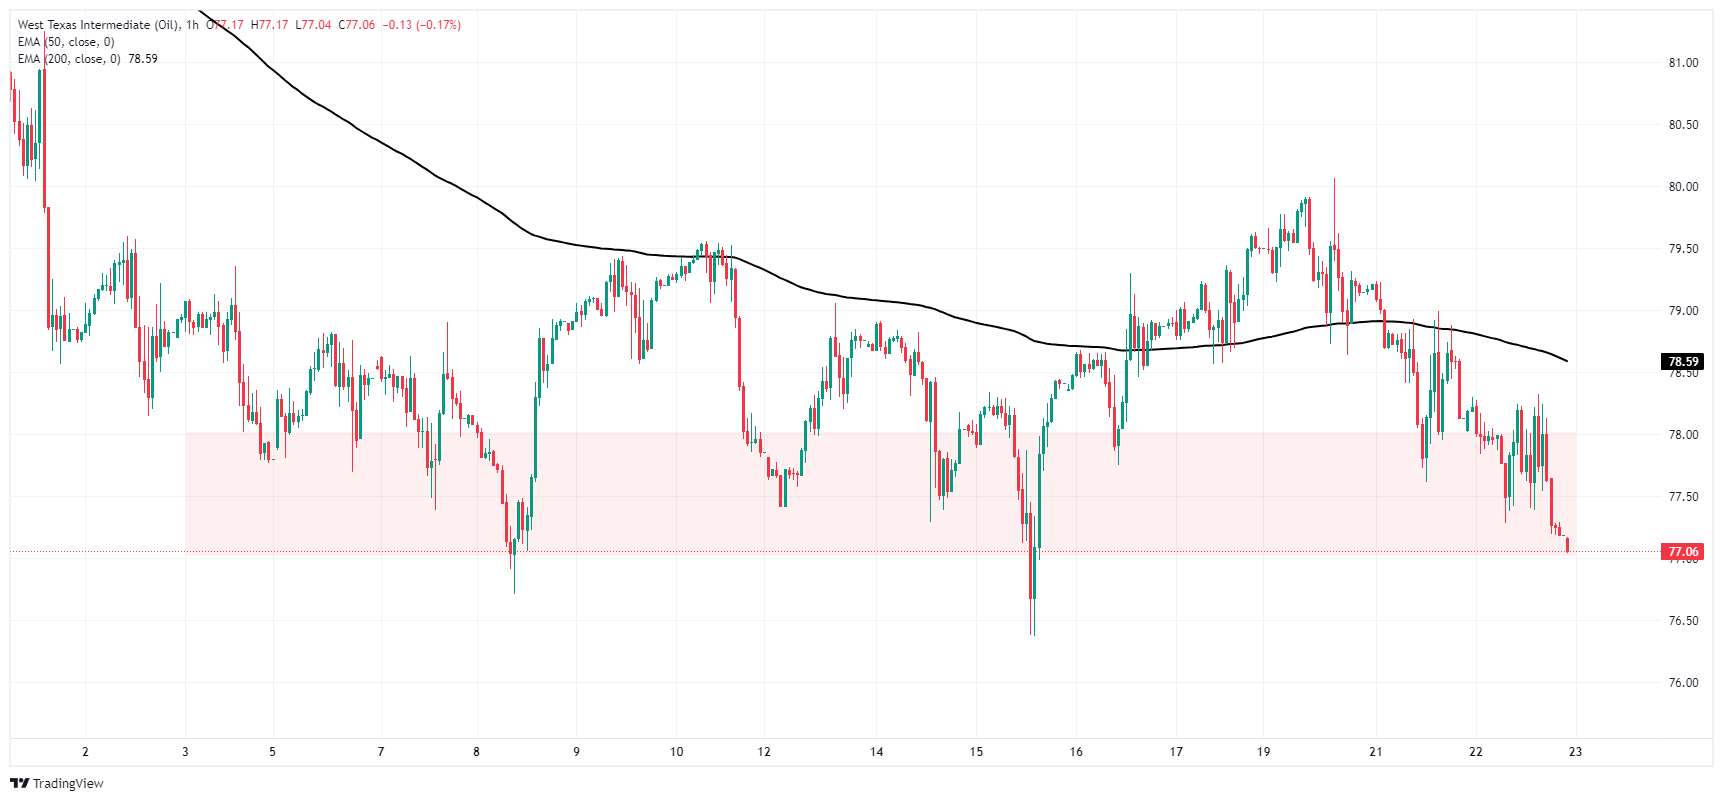
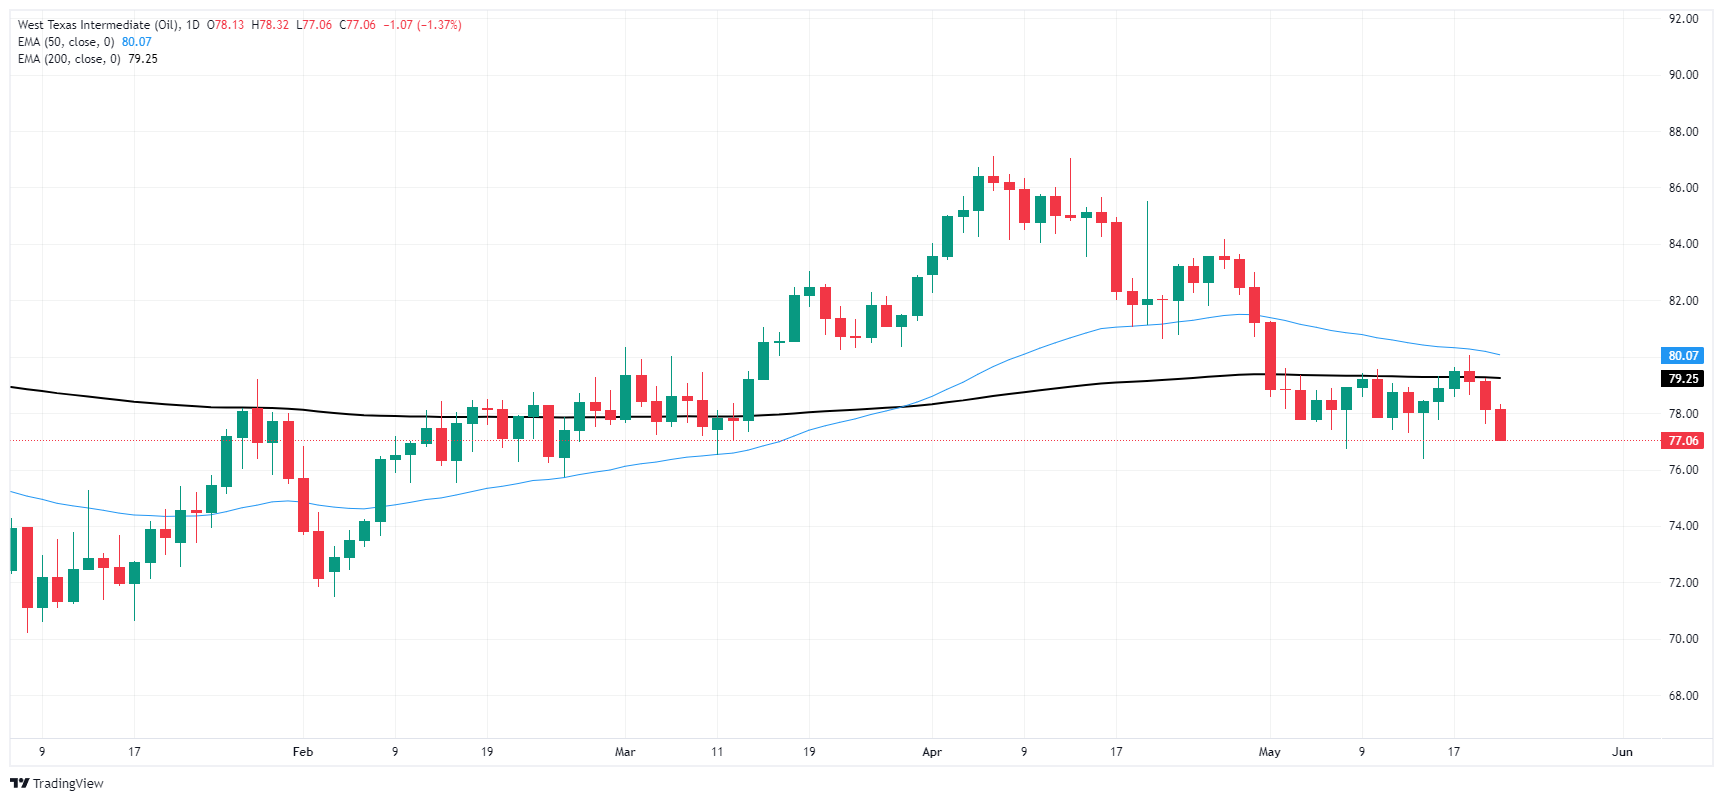
WTI US Crude Oil is testing down into $77.00 per barrel, extending a near-term decline from a recent peak just above $80.00 per barrel. Intraday price action has tumbled back into a familiar demand zone below $78.00 per barrel, and risks further downside if it breaks down below $76.50.

WTI closed in the red for a third consecutive trading day on Wednesday, increasing the odds of an extended technical rejection from the 200-day Exponential Moving Average (EMA) at $79.25.

WTI hourly chart
WTI daily chart
WTI US OIL

Overview
Today last price 77.05
Today Daily Change -1.08
Today Daily Change % -1.38
Today daily open 78.13
 
Trends
Daily SMA20 79.61
Daily SMA50 81.58
Daily SMA100 78.58
Daily SMA200 79.62
 
Levels
Previous Daily High 79.24
Previous Daily Low 77.62
Previous Weekly High 79.63
Previous Weekly Low 76.38
Previous Monthly High 87.12
Previous Monthly Low 80.62
Daily Fibonacci 38.2% 78.24
Daily Fibonacci 61.8% 78.62
Daily Pivot Point S1 77.42
Daily Pivot Point S2 76.71
Daily Pivot Point S3 75.8
Daily Pivot Point R1 79.04
Daily Pivot Point R2 79.95
Daily Pivot Point R3 80.66


Disclaimer: For information purposes only. Past performance is not indicative of future results.
placeholder
Understanding the first crypto market crash of 2024 and what to expect nextThe 365-day MVRV ratio suggests that this crash may be just the beginning. If the ETF is rejected before the second quarter of 2024, it could trigger a sharp correction.
Author  FXStreet
Jan 04, Thu
The 365-day MVRV ratio suggests that this crash may be just the beginning. If the ETF is rejected before the second quarter of 2024, it could trigger a sharp correction.
placeholder
Natural Gas sinks to pivotal level as China’s demand slumpsNatural Gas price (XNG/USD) edges lower and sinks to $2.56 on Monday, extending its losing streak for the fifth day in a row. The move comes on the back of China cutting its Liquified Natural Gas (LNG) imports after prices rose above $3.0 in June. It
Author  FXStreet
Jul 01, Mon
Natural Gas price (XNG/USD) edges lower and sinks to $2.56 on Monday, extending its losing streak for the fifth day in a row. The move comes on the back of China cutting its Liquified Natural Gas (LNG) imports after prices rose above $3.0 in June. It
placeholder
Ethereum ETFs Debut: BlackRock Reigns With $260M Inflows, Grayscale BleedsNine spot Ethereum ETFs commenced trading on the US stock market on Tuesday, marking a pivotal moment for the crypto industry following the Securities and Exchange Commission’s (SEC) green light on Monday.
Author  NewsBTC
Jul 25, Thu
Nine spot Ethereum ETFs commenced trading on the US stock market on Tuesday, marking a pivotal moment for the crypto industry following the Securities and Exchange Commission’s (SEC) green light on Monday.
placeholder
Sooner Fed rate cuts may not save economy from recessionInvesting.com -- Sooner Federal Reserve rate cuts may not be enough to stop the central bank from falling behind the curve, throwing the economy and the current stock bull market into a wreck. The ris
Author  Investing.com
Yesterday 01: 13
Investing.com -- Sooner Federal Reserve rate cuts may not be enough to stop the central bank from falling behind the curve, throwing the economy and the current stock bull market into a wreck. The ris
placeholder
Ethereum Whales Rapidly Accumulate ETH Amid Price DeclineEthereum whales have been busy in the market, as on-chain data shows that these investors have been heavily accumulating the second-largest crypto token by market cap.
Author  NewsBTC
Yesterday 01: 17
Ethereum whales have been busy in the market, as on-chain data shows that these investors have been heavily accumulating the second-largest crypto token by market cap.
goTop
quote