Gold sinks below $2,400 on FOMC’s hawkish minutes, traders booking profits

Source Fxstreet
  • Gold trades down more than 1% after hitting a high of $2,426.
  • US Treasury yields rise following hotter-than-expected UK inflation data.
  • Wall Street Journal reports central banks in emerging markets added 2,200 tons of Gold since Q3 2022, driven by Western sanctions on Russia.
  • Fed minutes reveal willingness to tighten policy further if economic risks materialize.

Gold plunged during the North American session on Wednesday, breaching below the $2,400 barrier, as traders seem to have booked profits ahead of the release of the last Federal Reserve (Fed) Meeting Minutes. Data from the United States (US) showed the housing market continued to show weakness, while Fed officials remained home after a busy week’s start.

The XAU/USD trades at $2,392, losing more than 1% after reaching a high of $2,426. US Treasury bond yields are rising following a hotter-than-expected inflation report from the UK, sending US yields higher. US equities are mixed ahead of NVIDIA’s earnings report release, while the Greenback edges up.

In the meantime, an article by The Wall Street Journal mentioned that Gold rallied due to central bank buying. According to the World Gold Council, central banks in emerging markets added around 2,200 tons of the golden metal since Q3 2022.

The article mentioned that the trigger might be Western sanctions on Russia after its invasion of Ukraine.

Aside from this, US Existing Home Sales plunged in April from 4.22 million to 4.14 million, or a -1.9 % contraction. Despite that, NAR Chief Economist Lawrence Yun said, “Home prices reaching a record high for the month of April is very good news for homeowners.”

Recently, the Fed released its latest meeting minutes, which showed that “Various participants mentioned willingness to tighten policy further should risks to outlook materialize and make such action appropriate.”

Daily digest market movers: Gold price falls as US yields climbed following hawkish Fed Minutes

  • Gold prices tumble sharply as US Treasury yields rise and Greenback advances. The US 10-year Treasury bond yield edges up 2 basis points to 4.434%, while the US Dollar Index (DXY), which tracks the Greenback’s performance against a basket of six other currencies, is up 0.19% at 104.82, a headwind for XAU/USD.
  • The FOMC Minutes showed that Fed officials remained uncertain about the degree of policy restrictiveness. They added that “it would take longer than previously anticipated to gain greater confidence in inflation moving sustainably to 2%.”
  • During the week, speeches by Fed officials laid the ground for the “hawkish tilt” of the FOMC’s Minutes, as most officials commented they would like to be certain that inflation is edging down and that they’re not in a rush to lower the fed funds rate.
  • Data from the Chicago Board of Trade shows investors are expecting 31 basis points of Fed easing toward the end of the year.

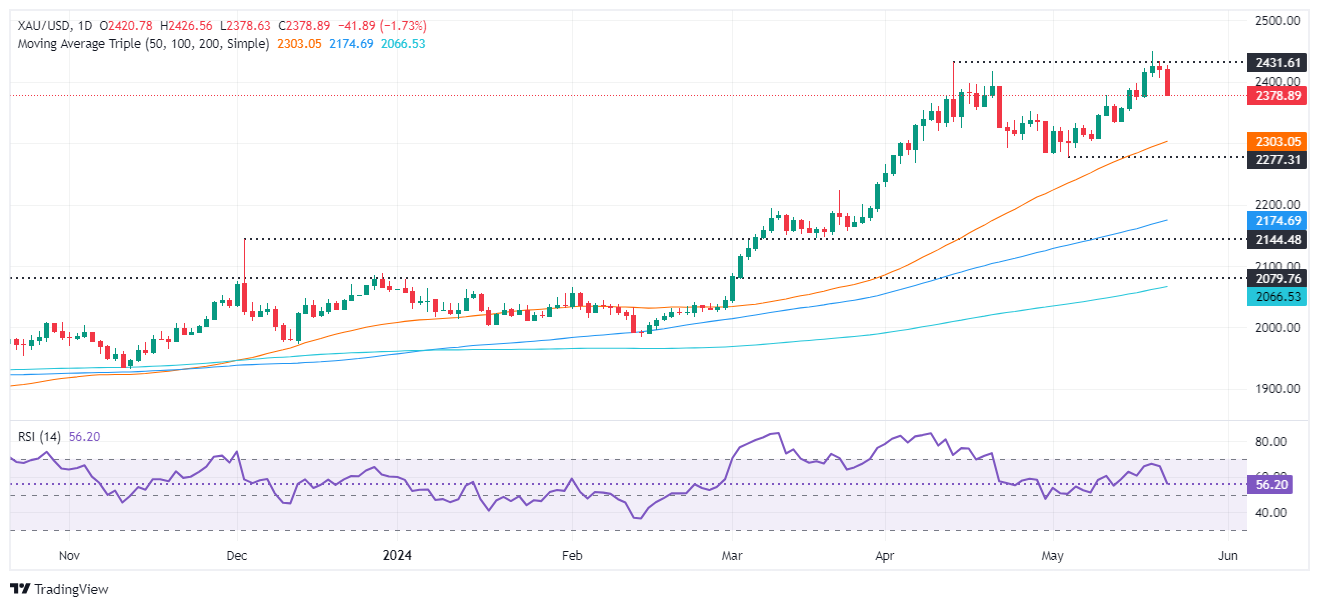
Technical analysis: Gold price slides below $2,400 as bears target $2,330

Gold price’s uptrend remains in place, yet Wednesday’s pullback could pave the way to test lower prices. Momentum is shifting negatively as the Relative Strength Index (RS), despite standing bullish, is aiming downwards. With that said, buying pressure is waning as sellers step in.

That said, the XAU/USD’s first support would be the May 13 low at $2,332, followed by the May 8 low of $2,303. Once those levels are surpassed, the 50-day Simple Moving Average (SMA) at $2,284 will be up next.

On the other hand, if buyers push the Gold price above $2,400, look for a retest of year-to-date highs at $2,450.

Gold FAQs

Gold has played a key role in human’s history as it has been widely used as a store of value and medium of exchange. Currently, apart from its shine and usage for jewelry, the precious metal is widely seen as a safe-haven asset, meaning that it is considered a good investment during turbulent times. Gold is also widely seen as a hedge against inflation and against depreciating currencies as it doesn’t rely on any specific issuer or government.

Central banks are the biggest Gold holders. In their aim to support their currencies in turbulent times, central banks tend to diversify their reserves and buy Gold to improve the perceived strength of the economy and the currency. High Gold reserves can be a source of trust for a country’s solvency. Central banks added 1,136 tonnes of Gold worth around $70 billion to their reserves in 2022, according to data from the World Gold Council. This is the highest yearly purchase since records began. Central banks from emerging economies such as China, India and Turkey are quickly increasing their Gold reserves.

Gold has an inverse correlation with the US Dollar and US Treasuries, which are both major reserve and safe-haven assets. When the Dollar depreciates, Gold tends to rise, enabling investors and central banks to diversify their assets in turbulent times. Gold is also inversely correlated with risk assets. A rally in the stock market tends to weaken Gold price, while sell-offs in riskier markets tend to favor the precious metal.

The price can move due to a wide range of factors. Geopolitical instability or fears of a deep recession can quickly make Gold price escalate due to its safe-haven status. As a yield-less asset, Gold tends to rise with lower interest rates, while higher cost of money usually weighs down on the yellow metal. Still, most moves depend on how the US Dollar (USD) behaves as the asset is priced in dollars (XAU/USD). A strong Dollar tends to keep the price of Gold controlled, whereas a weaker Dollar is likely to push Gold prices up.


Disclaimer: For information purposes only. Past performance is not indicative of future results.
placeholder
U.S. November Nonfarm Payrolls: What Does the Rare "Weak Jobs, Strong Economy" Mix Mean for U.S. Equities?1. IntroductionAfter retreating from the late-October highs, U.S. equities embarked on a bottoming rebound in mid-to-late November, a trend driven by the interplay of multiple factors. That said, it i
Author  TradingKey
10 hours ago
1. IntroductionAfter retreating from the late-October highs, U.S. equities embarked on a bottoming rebound in mid-to-late November, a trend driven by the interplay of multiple factors. That said, it i
placeholder
Senate Delays Crypto Market Structure Hearings to Early 2026The Senate Banking Committee has postponed cryptocurrency market structure hearings until 2026, citing ongoing bipartisan negotiations.
Author  Mitrade
15 hours ago
The Senate Banking Committee has postponed cryptocurrency market structure hearings until 2026, citing ongoing bipartisan negotiations.
placeholder
Bitcoin Slides 5% as Sellers Lean In — Can BTC Reclaim $88,000?Bitcoin has dropped back below $88,000 after rolling over from $90,500, with price still trading under the 100-hour Simple Moving Average. The sell-off found a floor at $85,151, and BTC is now consolidating near that base, but rebounds are facing pressure from a bearish trend line around $89,000. Bulls need to retake $88,000–$89,000 to ease downside risk; failure to do so keeps $85,500–$85,000 and then $83,500 in play, with $80,000 as the deeper “line in the sand.” Bitcoin (BTC) is back in damage-control mode after a sharp pullback wiped out recent gains. The price failed to reclaim the $90,000–$90,500 band, rolled over, and slid through $88,500 before briefly dipping under $87,000. Buyers did show up around $85,000, but the rebound so far looks more like stabilization than a clear trend reversal. Bitcoin dips hard, finds a bid near $85,000(h3) BTC’s latest move lower began when it couldn’t build follow-through above $90,000 and $90,500. Once that upside stalled, sellers took control and pushed price down through $88,500. The slide accelerated enough to spike below $87,000, but the market didn’t free-fall. Bulls defended the $85,000 zone, printing a low at $85,151. Since then, Bitcoin has been consolidating below the 23.6% Fibonacci retracement of the drop from the $93,560 swing high to the $85,151 low — a clue that the bounce is still shallow and that sellers haven’t fully backed off yet. Structurally, BTC is still on the back foot: It’s trading below $88,000, and It remains below the 100-hour Simple Moving Average, keeping short-term trend pressure pointed downward. Resistance is layered, and $89,000 is the problem area(h3) If bulls try to turn this into a recovery, they’ll have to climb through multiple ceilings in quick succession. First, BTC faces resistance around $87,150, followed by a more meaningful barrier near $87,500. From there, the market’s attention snaps back to $88,000 — the level BTC just lost and now needs to reclaim. A close back above $88,000 would improve the tone, but it doesn’t solve the bigger issue: there’s a bearish trend line on the hourly BTC/USD chart (Kraken feed) with resistance near $89,000, which also lines up with the next technical hurdle. If BTC can push through $89,000 and hold, the rebound could extend toward $90,000, with follow-through targets at $91,000 and $91,500. But until price clears that $88,000–$89,000 zone, rallies are at risk of being sold rather than chased. If BTC fails to reclaim resistance, the downside path is clear(h3) The near-term bear case is simple: if Bitcoin can’t climb back above the $87,000 area and keep traction, sellers may attempt another leg lower. Support levels line up like this: Immediate support: $85,500 First major support: $85,000 Next support: $83,500 Then $82,500 in the near term Below that, the major “don’t break this” level is still $80,000. If BTC slips under $80,000, the risk of acceleration to the downside increases significantly — not because it’s magic, but because it’s the kind of psychological and structural level that tends to trigger forced de-risking. Indicators: momentum still leans bearish(h3) The intraday indicators aren’t offering much comfort yet: Hourly MACD is losing pace in the bearish zone. Hourly RSI remains below 50, suggesting sellers still have the upper hand on short timeframes. So while the $85,000 defense held for now, the market hasn’t flipped bullish — it’s just stopped bleeding.
Author  Mitrade
18 hours ago
Bitcoin has dropped back below $88,000 after rolling over from $90,500, with price still trading under the 100-hour Simple Moving Average. The sell-off found a floor at $85,151, and BTC is now consolidating near that base, but rebounds are facing pressure from a bearish trend line around $89,000. Bulls need to retake $88,000–$89,000 to ease downside risk; failure to do so keeps $85,500–$85,000 and then $83,500 in play, with $80,000 as the deeper “line in the sand.” Bitcoin (BTC) is back in damage-control mode after a sharp pullback wiped out recent gains. The price failed to reclaim the $90,000–$90,500 band, rolled over, and slid through $88,500 before briefly dipping under $87,000. Buyers did show up around $85,000, but the rebound so far looks more like stabilization than a clear trend reversal. Bitcoin dips hard, finds a bid near $85,000(h3) BTC’s latest move lower began when it couldn’t build follow-through above $90,000 and $90,500. Once that upside stalled, sellers took control and pushed price down through $88,500. The slide accelerated enough to spike below $87,000, but the market didn’t free-fall. Bulls defended the $85,000 zone, printing a low at $85,151. Since then, Bitcoin has been consolidating below the 23.6% Fibonacci retracement of the drop from the $93,560 swing high to the $85,151 low — a clue that the bounce is still shallow and that sellers haven’t fully backed off yet. Structurally, BTC is still on the back foot: It’s trading below $88,000, and It remains below the 100-hour Simple Moving Average, keeping short-term trend pressure pointed downward. Resistance is layered, and $89,000 is the problem area(h3) If bulls try to turn this into a recovery, they’ll have to climb through multiple ceilings in quick succession. First, BTC faces resistance around $87,150, followed by a more meaningful barrier near $87,500. From there, the market’s attention snaps back to $88,000 — the level BTC just lost and now needs to reclaim. A close back above $88,000 would improve the tone, but it doesn’t solve the bigger issue: there’s a bearish trend line on the hourly BTC/USD chart (Kraken feed) with resistance near $89,000, which also lines up with the next technical hurdle. If BTC can push through $89,000 and hold, the rebound could extend toward $90,000, with follow-through targets at $91,000 and $91,500. But until price clears that $88,000–$89,000 zone, rallies are at risk of being sold rather than chased. If BTC fails to reclaim resistance, the downside path is clear(h3) The near-term bear case is simple: if Bitcoin can’t climb back above the $87,000 area and keep traction, sellers may attempt another leg lower. Support levels line up like this: Immediate support: $85,500 First major support: $85,000 Next support: $83,500 Then $82,500 in the near term Below that, the major “don’t break this” level is still $80,000. If BTC slips under $80,000, the risk of acceleration to the downside increases significantly — not because it’s magic, but because it’s the kind of psychological and structural level that tends to trigger forced de-risking. Indicators: momentum still leans bearish(h3) The intraday indicators aren’t offering much comfort yet: Hourly MACD is losing pace in the bearish zone. Hourly RSI remains below 50, suggesting sellers still have the upper hand on short timeframes. So while the $85,000 defense held for now, the market hasn’t flipped bullish — it’s just stopped bleeding.
placeholder
AUD/USD remains depressed below mid-0.6600s; downside seems limited ahead of US NFP reportThe AUD/USD pair attracts some sellers for the fourth straight day on Tuesday and trades around the 0.6630 region, down just over 0.10%, during the Asian session.
Author  FXStreet
19 hours ago
The AUD/USD pair attracts some sellers for the fourth straight day on Tuesday and trades around the 0.6630 region, down just over 0.10%, during the Asian session.
placeholder
Macro Analysts: Hawkish Japan Could Push Bitcoin Below $70KAnalysts predict Bitcoin may face further declines towards the $70,000 mark if the Bank of Japan raises interest rates as expected.
Author  Mitrade
Yesterday 05: 48
Analysts predict Bitcoin may face further declines towards the $70,000 mark if the Bank of Japan raises interest rates as expected.
goTop
quote