Silver Price Forecast: XAG/USD tumbles to $31.50 with eyes on FOMC minutes

Source Fxstreet
  • Silver price plummets to $31.50 amid caution ahead of Fed’s May policy minutes.
  • Fed policymakers support higher interest rates for a longer period.
  • Silver price consolidates near multi-year high around $32.50

Silver price (XAG/USD) posts a vertical fall to near the crucial support of $31.50 in Wednesday’s early New York session. The white metal weakens as the US Dollar and bond yields recover amid caution ahead of the release of the Federal Open Market Committee (FOMC) minutes of the May policy meeting that will be published later the day. The FOMC minutes will provide a detailed explanation behind policymakers’ view on the interest rate outlook.

The market sentiment is slightly cautious as Federal Reserve (Fed) policymakers continue supporting that interest rates should remain at their current levels until inflation returns sustainably to the desired rate of 2%. S&P 500 futures posted losses in the European session, exhibiting a decline in investors’ risk-appetite.

The US Dollar Index (DXY), which tracks the Greenback’s value, jumps to 104.90. 10-year US Treasury Yields rise to 4.46% as hawkish guidance on interest rates from Fed officials has deepened uncertainty over Fed reducing interest rates from the September meeting. On Tuesday, Cleveland Fed Bank President Loretta Mester said that he wants to see inflation declining few more months to be sure before considering rate cuts.

Higher yields on interest-bearish assets increase the opportunity cost of holding investment in the non-yielding assets, such as Silver.

Silver technical analysis

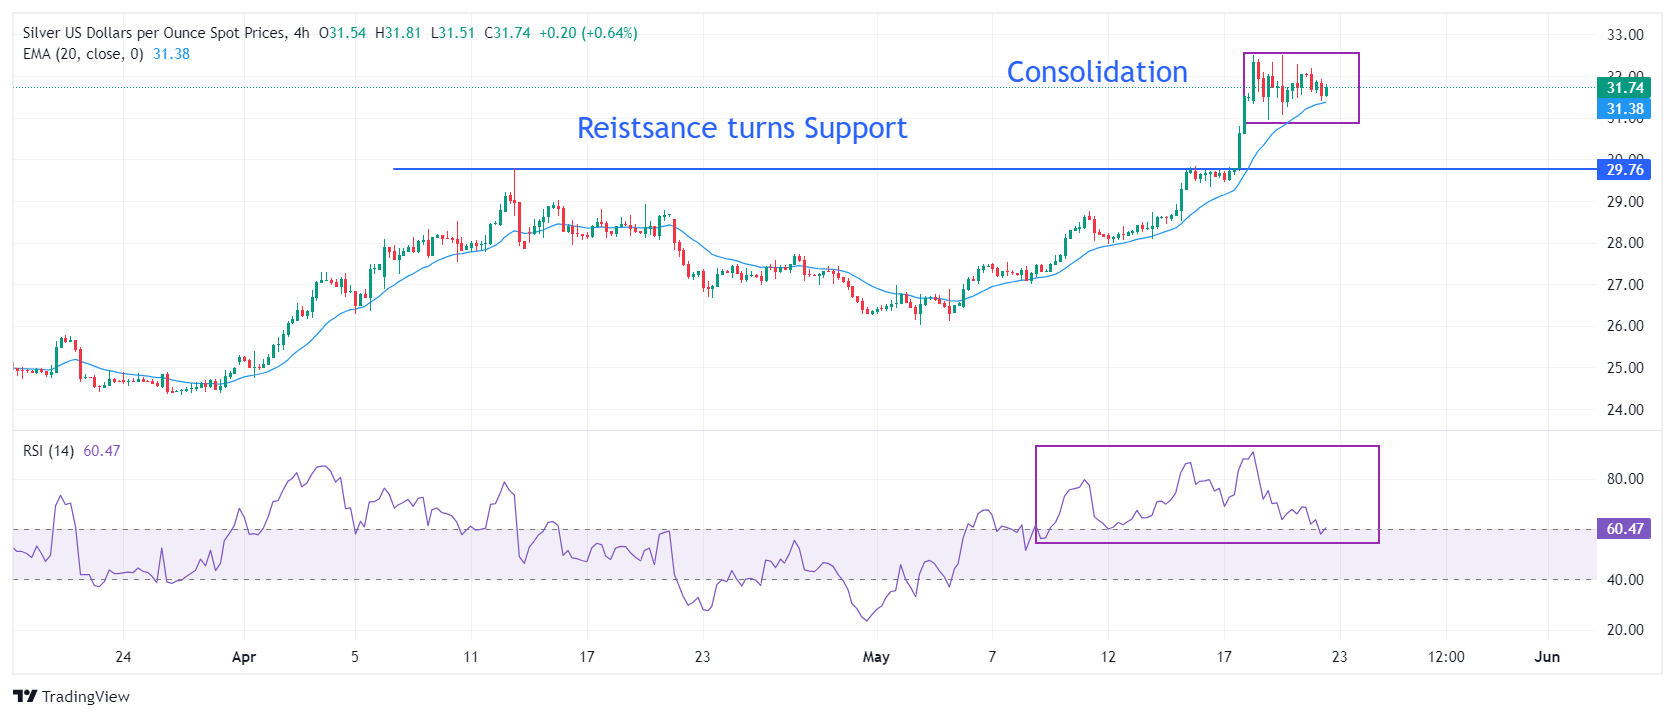
Silver price turns sideways after printing a fresh multi-year high near $32.50. The white metal delivered a sharp upside move after breaking above the horizontal resistance plotted from April 12 high at $29.80. The upward-sloping 20-period Exponential Moving Average (EMA) near $31.40 suggests that the upside trend is intact.

The 14-period Relative Strength Index (RSI) shifts comfortably into the bullish range of 60.00-80.00, indicating that momentum remains leaned to the upside.

Silver four-hour chart

XAG/USD

Overview
Today last price 31.76
Today Daily Change -0.22
Today Daily Change % -0.69
Today daily open 31.98
 
Trends
Daily SMA20 28.25
Daily SMA50 27.15
Daily SMA100 25.06
Daily SMA200 24.17
 
Levels
Previous Daily High 32.5
Previous Daily Low 31.07
Previous Weekly High 31.6
Previous Weekly Low 27.97
Previous Monthly High 29.8
Previous Monthly Low 24.75
Daily Fibonacci 38.2% 31.96
Daily Fibonacci 61.8% 31.62
Daily Pivot Point S1 31.2
Daily Pivot Point S2 30.42
Daily Pivot Point S3 29.77
Daily Pivot Point R1 32.63
Daily Pivot Point R2 33.28
Daily Pivot Point R3 34.06


Disclaimer: For information purposes only. Past performance is not indicative of future results.
placeholder
New Fed Chair to Cut Forward Guidance? Warsh Rejects Dot-Plot Expectations, Bullish or Bearish for Bitcoin? If Warsh rejects dot plot projections, it could suppress institutional capital and weaken market risk appetite in the short term, but is a long-term positive for Bitcoin.On June 17, Asian
Author  TradingKey
6 hours ago
If Warsh rejects dot plot projections, it could suppress institutional capital and weaken market risk appetite in the short term, but is a long-term positive for Bitcoin.On June 17, Asian
placeholder
Three Major International Investment Banks Bearish on Oil Outlook, Citi Expects Brent to Fall to $70. Crude Oil Prices Fall for Four Straight Days to Levels at Start of US-Iraq War.On June 16, after US President Donald Trump sent consecutive signals of geopolitical easing, the two major crude oil benchmarks extended their recent declines and are poised to return to
Author  TradingKey
14 hours ago
On June 16, after US President Donald Trump sent consecutive signals of geopolitical easing, the two major crude oil benchmarks extended their recent declines and are poised to return to
placeholder
Japanese Yen hangs near intervention zone despite BoJ rate hike, ahead of FOMCThe USD/JPY pair ticks lower during the Asian session on Wednesday, though it remains within striking distance of the highest level since late April, touched last week.
Author  FXStreet
14 hours ago
The USD/JPY pair ticks lower during the Asian session on Wednesday, though it remains within striking distance of the highest level since late April, touched last week.
placeholder
Has Gold Hit Bottom? Barclays, Citi Both Bullish on Gold, Gold Price Will Return to $5,000 Next Year.Since 2026, gold has erased almost all of its gains and has fallen more than 20% from its record high of $5,595 set at the end of January. Has gold bottomed out? Is now the time to add to
Author  TradingKey
Yesterday 10: 30
Since 2026, gold has erased almost all of its gains and has fallen more than 20% from its record high of $5,595 set at the end of January. Has gold bottomed out? Is now the time to add to
placeholder
WTI hovers around $80.00 as traders await developments on US-Iran peace talksWest Texas Intermediate (WTI) oil price inches higher after registering 3.7% losses in the previous day, trading around $80.10 per barrel during the Asian hours on Tuesday.
Author  FXStreet
Yesterday 01: 19
West Texas Intermediate (WTI) oil price inches higher after registering 3.7% losses in the previous day, trading around $80.10 per barrel during the Asian hours on Tuesday.
Related Instrument
goTop
quote