Silver Price Analysis: Reaches a technical crossroads

Source Fxstreet
  • Silver price has reached a pivotal point in its technical development. 
  • There is a possibility of both a continuation to new highs and deeper correction. 
  • The trend broadly remains bullish, however, favoring an eventual resumption higher even if a correction unfolds. 

Silver (XAG/USD) price is consolidating in the $31.60s on Tuesday after pulling back from Monday’s eleven-year high of $32.51. 

The pair remains in a short-term uptrend which is biased to extend. It could be forming a Bull Flag continuation pattern (shaded rectangle on chart). 

Silver 4-hour Chart 

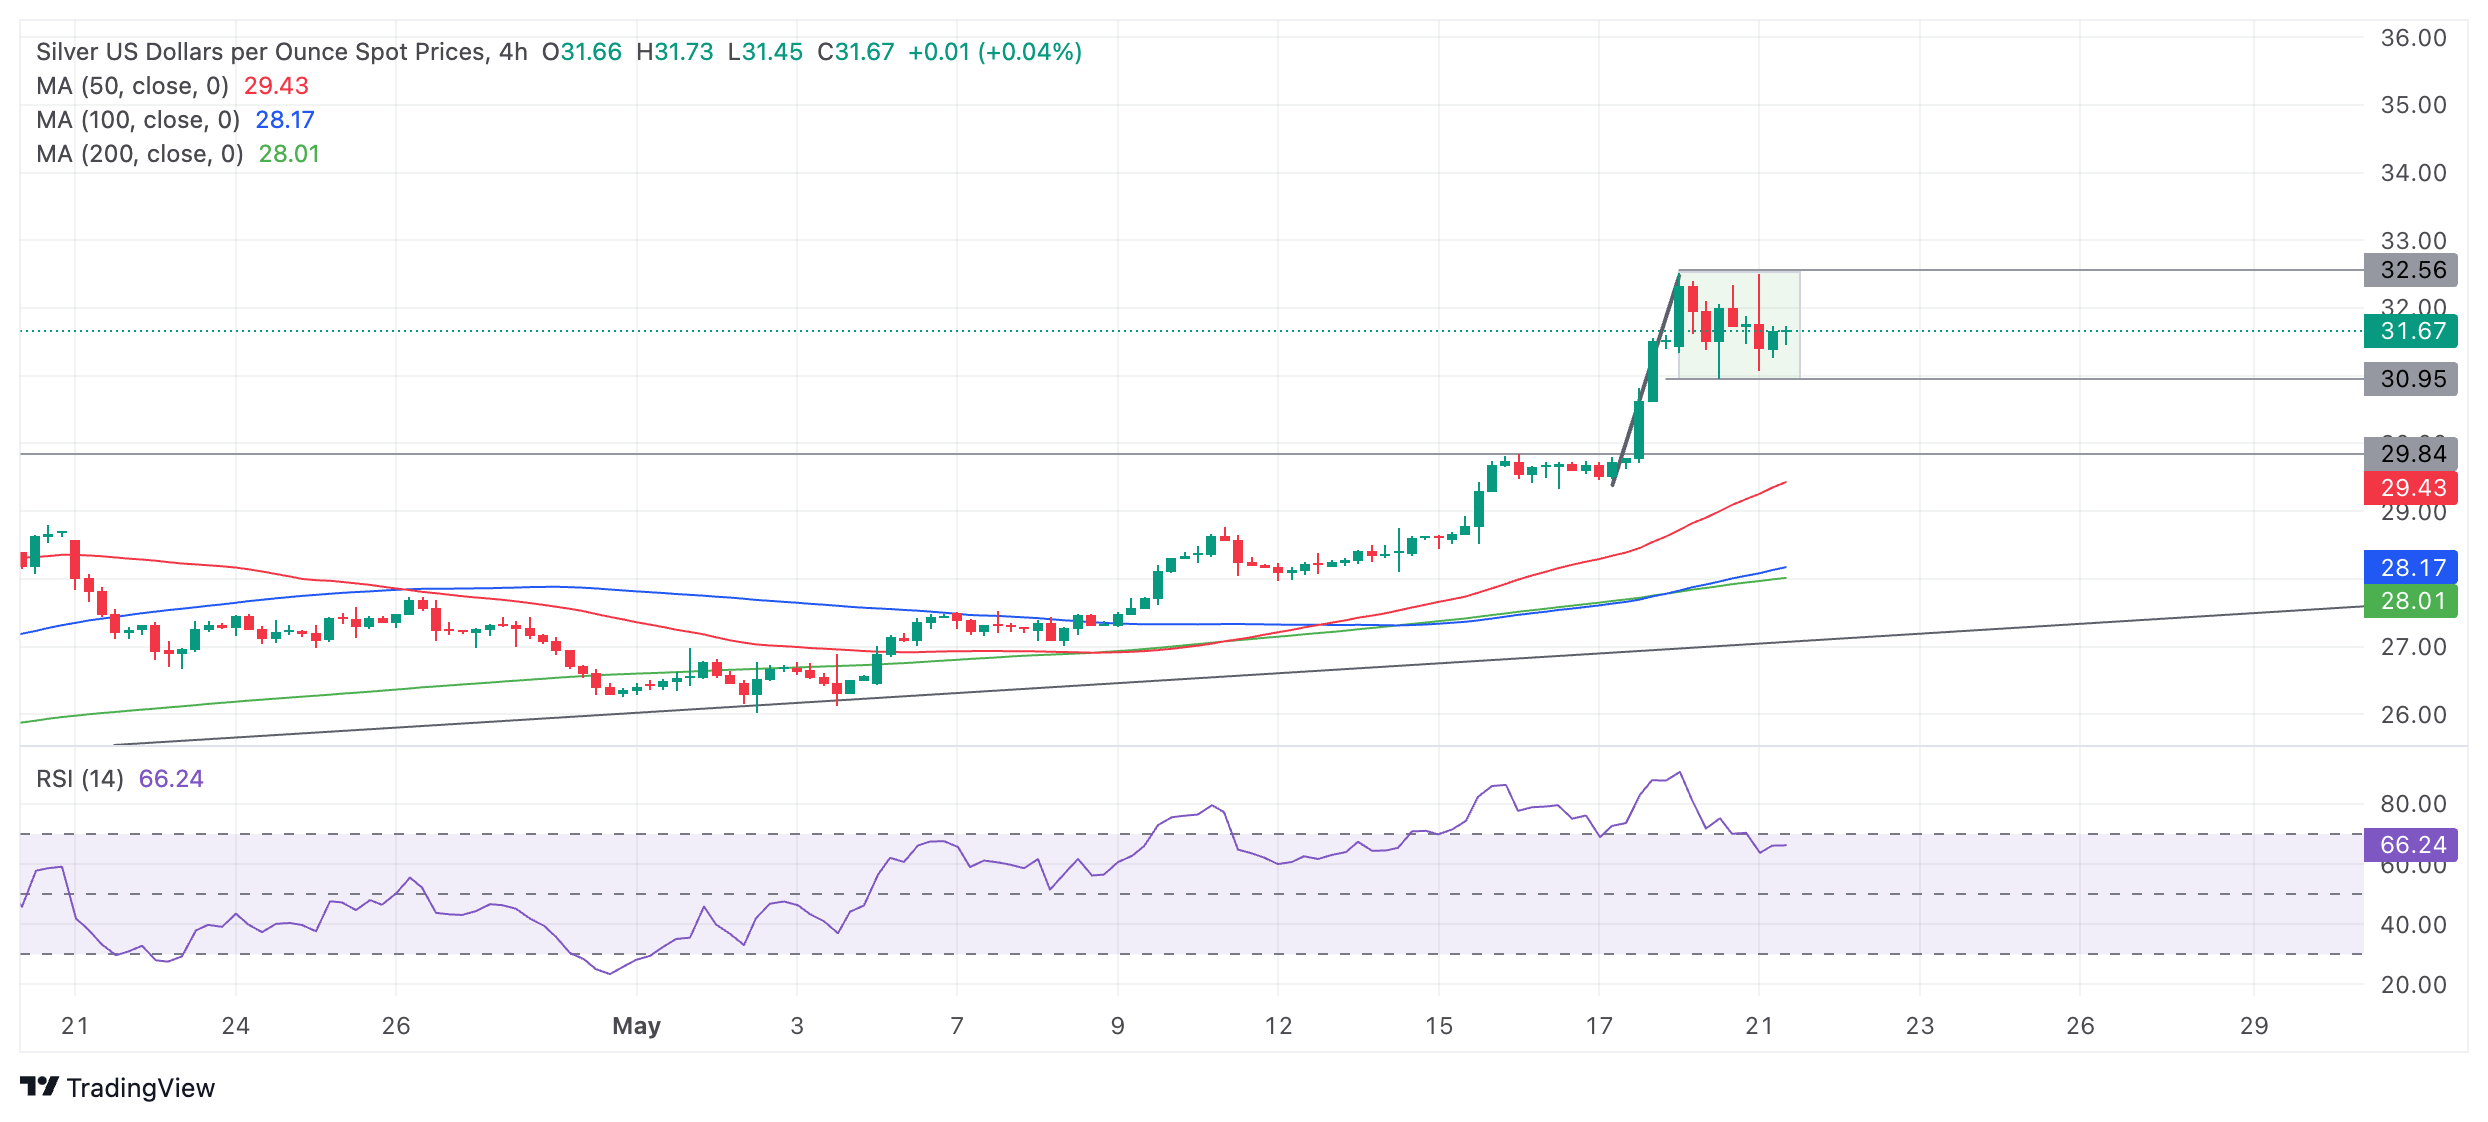
If Silver price breaks out of the consolidation rectangle on a closing basis it will activate the Bull Flag and continue the trend higher to the next target at $33.83-5. Further bullishness could even see Silver reach $35.34, a key former high.

A break on a closing basis below the current consolidation range’s lows at $30.95, however, would probably signal a deeper correction was unfolding. 

Silver Daily Chart 

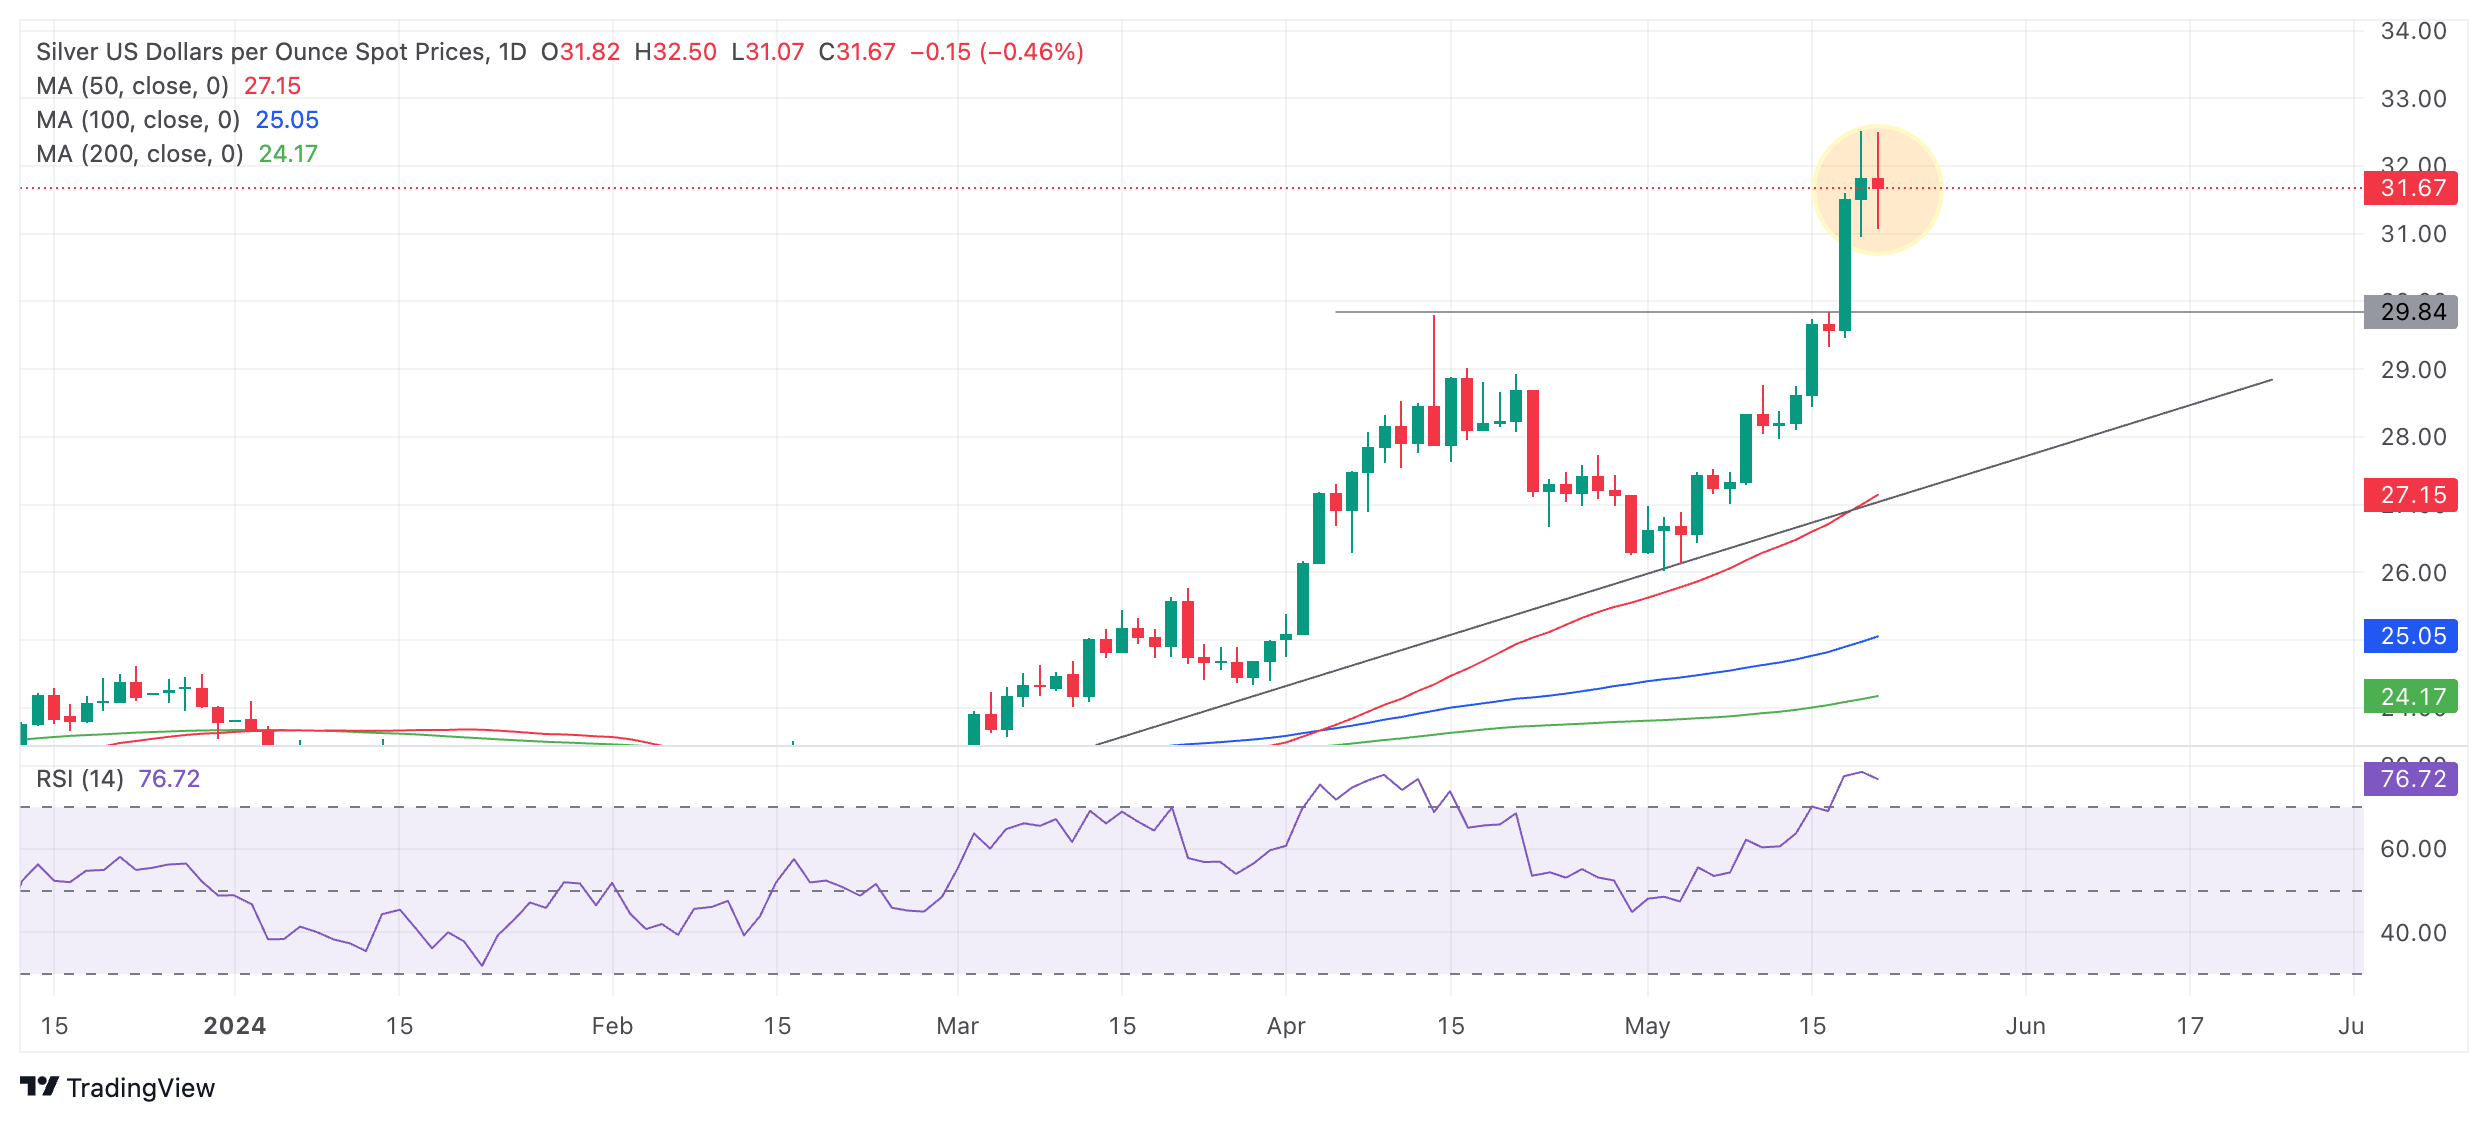
The daily chart is showing some bearish signs which could indicate the possibility of a deeper pull back evolving, however, it is still too early to say for sure. 

A Tweezer Top Japanese candlestick pattern might be forming (shaded circle above) which if confirmed would be a bearish short-term reversal signal. Tweezer Top candlestick patterns occur where price reaches a peak and forms two consecutive days which have long upper wicks – the thin part of the candle from the shaded body up to the high – and whose highs are at a similar level. If Tuesday’s candle closes with a shape similar to the one at the time of writing it will be a signal a Tweezer Top has formed, with bearish connotations. 

The Relative Strength Index (RSI) is also deeply in the overbought zone on the daily chart, suggesting traders should not add to their long holdings. If the RSI exits overbought on a closing basis it will signal a deeper correction is taking place. 

A more bearish correction is likely to find support initially at the $30.00 level of the former range highs. Given the short and medium term trends are still bullish, however, Silver is likely to resume rallying after its correction finalizes. 

It would require a decisive break below the $30.00 level to bring the uptrend into doubt.

A decisive break would be one accompanied by a long red candlestick that closed near its lows or three red candlesticks in a row. 


Disclaimer: For information purposes only. Past performance is not indicative of future results.
placeholder
Silver Price Analysis: Climbs above $80, as bulls eye weekly highSilver price advances more than 2.50% on Friday, set to end the week with gains of over 7% sponsored by US Dollar weakness and falling oil prices. At the time of writing, the XAG/USD trades at $80.72, after bouncing off daily lows of $78.16.
Author  FXStreet
17 hours ago
Silver price advances more than 2.50% on Friday, set to end the week with gains of over 7% sponsored by US Dollar weakness and falling oil prices. At the time of writing, the XAG/USD trades at $80.72, after bouncing off daily lows of $78.16.
placeholder
April NFP Lands at 8:30 AM Today — 65K Forecast, a New Fed Chair, and the Dollar at Triple-Bottom SupportApril 2026 NFP forecast 62K–70K vs March 178K. Unemployment expected 4.3%. Fed on hold at 3.50–3.75% with Kevin Warsh as new chair. DXY triple-bottom at $97.69. Trade setup inside.The Apr
Author  TradingKey
Yesterday 10: 55
April 2026 NFP forecast 62K–70K vs March 178K. Unemployment expected 4.3%. Fed on hold at 3.50–3.75% with Kevin Warsh as new chair. DXY triple-bottom at $97.69. Trade setup inside.The Apr
placeholder
WTI falls to near $93.50 after Israel, Iran signal an end to hostilitiesWest Texas Intermediate (WTI) oil price loses ground after registering modest gains in the previous day, trading around $93.70 per barrel during the Asian hours on Friday.
Author  FXStreet
Yesterday 01: 21
West Texas Intermediate (WTI) oil price loses ground after registering modest gains in the previous day, trading around $93.70 per barrel during the Asian hours on Friday.
placeholder
WTI and Brent Futures Both Fall Below $100 Mark, Have Oil Prices and Energy Sector Peaked?WTI crude oil futures settled at $96.21 per barrel on May 6, plunging 6.3% to close below $100 for the first time in six days, marking the largest single-day decline since March 17. Brent
Author  TradingKey
May 07, Thu
WTI crude oil futures settled at $96.21 per barrel on May 6, plunging 6.3% to close below $100 for the first time in six days, marking the largest single-day decline since March 17. Brent
placeholder
Bitcoin jumps to three-month high as US–Iran talks unwind oil risk premiumGlobal markets moved sharply on Wednesday as signs of progress in US–Iran negotiations triggered a rapid unwind of war-driven positions, dragging oil prices lower while lifting equities and cryptocurrencies. Bitcoin climbed above $81,000, its highest level in three months, while Brent crude fell roughly 11% to around $98 per barrel. The S&P 500 rose 0.85%...
Author  Cryptopolitan
May 07, Thu
Global markets moved sharply on Wednesday as signs of progress in US–Iran negotiations triggered a rapid unwind of war-driven positions, dragging oil prices lower while lifting equities and cryptocurrencies. Bitcoin climbed above $81,000, its highest level in three months, while Brent crude fell roughly 11% to around $98 per barrel. The S&P 500 rose 0.85%...
Related Instrument
goTop
quote