

Oil eases further after string of technical rejections
- Oil tests the support of its 2024 rally again on Tuesday.
- Markets disregard current events in the Middle East as there is no risk for output in the region.
- The US Dollar Index is looking for direction, caught in a tight range at the beginning of the week.
Oil prices edge lower and trade around $78.50 on Tuesday, testing market belief and support for further upside. Traders are not hanging any weight or importance of risk on the two main headlines that came out on Monday and today. On the one side, the funeral of the Iranian President who crashed in a helicopter accident. The second is the international arrest warrant from the International Criminal Court for Israeli leader Benjamin Netanyahu and the country’s defence minister on war crimes charges.
Meanwhile, the US Dollar Index (DXY), which tracks the performance of the US Dollar against a basket of six major currencies, is looking for direction, with markets flip-flopping between risk-on and risk-off ahead of Nvidia earnings later in the day. With another big batch of Federal Reserve (Fed) speakers scheduled on Tuesday, it almost feels like a ‘play and repeat’ from every Fed member. So, there is likely no new insights that could hint at the exact timing for the initial interest rate cut from the Fed.
At the time of writing, Crude Oil (WTI) trades at $78.52 and Brent Crude at $82.79.
Oil news and market movers: Despite headlines, no risk added
- Several countries have issued warnings and have asked to remain on high alert with possible retaliations in the wake of the helicopter accident in which the Iranian President died.
- US President Joe Biden has lashed out at the International Criminal Court in an attempt to stand by its ally Israel, Reuters reported.
- Bloomberg News reports that President Vladimir Putin said Russia’s Oil output declined by 1.8% at the start of 2024 compared to the same period last year.
- At 20:30 GMT, the American Petroleum Institute (API) will release the numbers for the US crude weekly stockpile change for the week ending May 17 on Tuesday. The previous number was a drawdown of 3.104 million barrels.
Oil Technical Analysis: How long can this support last?
Oil prices are again testing the upward-sloping trend line from the December low for nearly a third week in a row. Although a slew of headlines is coming out of the Middle East, traders are not labelling any of the events or headlines as a risk element that could cause disruptions to either oil supply out of the region or for global trade. This makes Oil an outlier, where Oil traders are missing out on the commodity rally that is taking place in precious metals and Gas futures.
On the upside, the line in the sand remains at the 200-day Simple Moving Average (SMA), currently at $79.62. Once above that level, a double layer comes up with the 100-day SMA at $78.58. In case of an upward extension above that zone, the road is open for $87.12 again.
On the downside, the pivotal level at $75.28 is the last solid line in the sand that could support the end this decline. If this level is unable to hold, investors could expect an accelerated sell-off towards $72.00 and $70.00,. That would erasinge all gains for 2024. Further down, and then Oil price could test $68, the December 13 low.
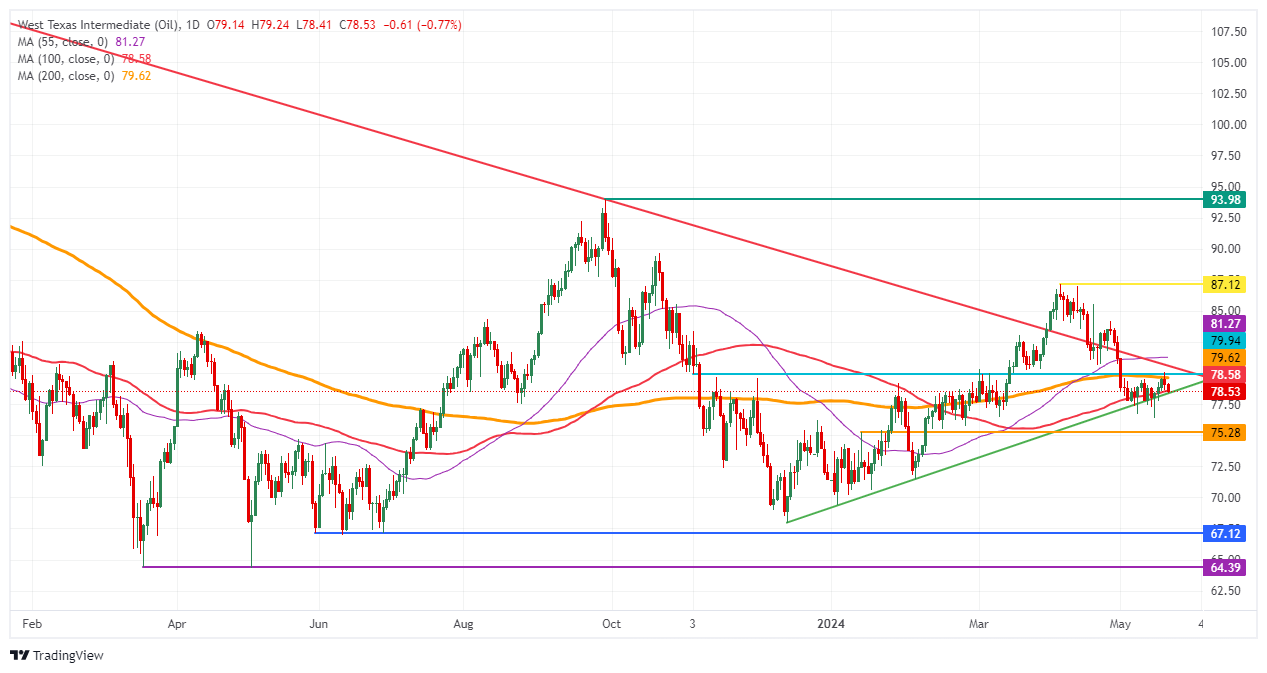
US WTI Crude Oil: Daily Chart
WTI Oil FAQs
WTI Oil is a type of Crude Oil sold on international markets. The WTI stands for West Texas Intermediate, one of three major types including Brent and Dubai Crude. WTI is also referred to as “light” and “sweet” because of its relatively low gravity and sulfur content respectively. It is considered a high quality Oil that is easily refined. It is sourced in the United States and distributed via the Cushing hub, which is considered “The Pipeline Crossroads of the World”. It is a benchmark for the Oil market and WTI price is frequently quoted in the media.
Like all assets, supply and demand are the key drivers of WTI Oil price. As such, global growth can be a driver of increased demand and vice versa for weak global growth. Political instability, wars, and sanctions can disrupt supply and impact prices. The decisions of OPEC, a group of major Oil-producing countries, is another key driver of price. The value of the US Dollar influences the price of WTI Crude Oil, since Oil is predominantly traded in US Dollars, thus a weaker US Dollar can make Oil more affordable and vice versa.
The weekly Oil inventory reports published by the American Petroleum Institute (API) and the Energy Information Agency (EIA) impact the price of WTI Oil. Changes in inventories reflect fluctuating supply and demand. If the data shows a drop in inventories it can indicate increased demand, pushing up Oil price. Higher inventories can reflect increased supply, pushing down prices. API’s report is published every Tuesday and EIA’s the day after. Their results are usually similar, falling within 1% of each other 75% of the time. The EIA data is considered more reliable, since it is a government agency.
OPEC (Organization of the Petroleum Exporting Countries) is a group of 13 Oil-producing nations who collectively decide production quotas for member countries at twice-yearly meetings. Their decisions often impact WTI Oil prices. When OPEC decides to lower quotas, it can tighten supply, pushing up Oil prices. When OPEC increases production, it has the opposite effect. OPEC+ refers to an expanded group that includes ten extra non-OPEC members, the most notable of which is Russia.
Recommended Articles


