

Gold pulls back after touching a new all-time high
- Gold price is correcting lower after touching an all-time high of $2,450 on Monday.
- Acute bearish divergence on the daily chart could indicate a deeper correction may follow.
- The pullback appears to be driven by central banks communicating a reluctance to lower interest rates.
Gold price (XAU/USD) retreats to the $2,410s on Tuesday as commentary from central bank policymakers around the globe reveals a reluctance to commit to lowering interest rates. The precious metal tends to perform more poorly in an environment of relatively higher interest rates because of the returns investors can reap by remaining in cash or bonds.
Persistent geopolitical concerns stemming from conflicts in the Middle East and Ukraine, however, are acting as a positive counterweight for Gold price. Gold hoarding by emerging markets and BRICS nations’ central banks as an insurance policy against Western sanctions that usually target US Dollar (USD) or Euro (EUR) reserves, is a further supporting factor.
Gold price retreats on shift in outlook for interest rates
Gold price pulls back on Tuesday after central bankers in the US and Australia not only refuse to commit to lowering interest rates but also discuss the possibility of raising them.
On Monday, Federal Reserve Bank of Cleveland President Loretta Mester said the Fed could “even raise them (rates)” if inflation rose, and that it was “no longer appropriate” to expect the Fed to make three cuts this year.
On Tuesday morning, the Reserve Bank of Australia (RBA) released the minutes from its May meeting, which revealed that the board of governors had discussed the possibility of raising interest rates. It was the first time in many months they had discussed policy tightening.
Technical Analysis: Gold price pulls back, RSI diverging
Gold price (XAU/USD) has pulled back from all-time highs at around $2,450 on Tuesday after forming a Shooting Star Japanese candlestick pattern on Monday. This candlestick pattern occurs when the price reaches a new high and then retreats to close near its low. It is a bearish sign after an uptrend, especially when followed by a red bearish candlestick on the next day, as is currently the case. If Tuesday ends as a red down day it could be a sign of a deeper correction to come.
However, if Tuesday ends as a green bullish day, it will reduce the significance of the Shooting Star and could be a sign that the dominant bullish trend is more likely to continue.
XAU/USD Daily Chart
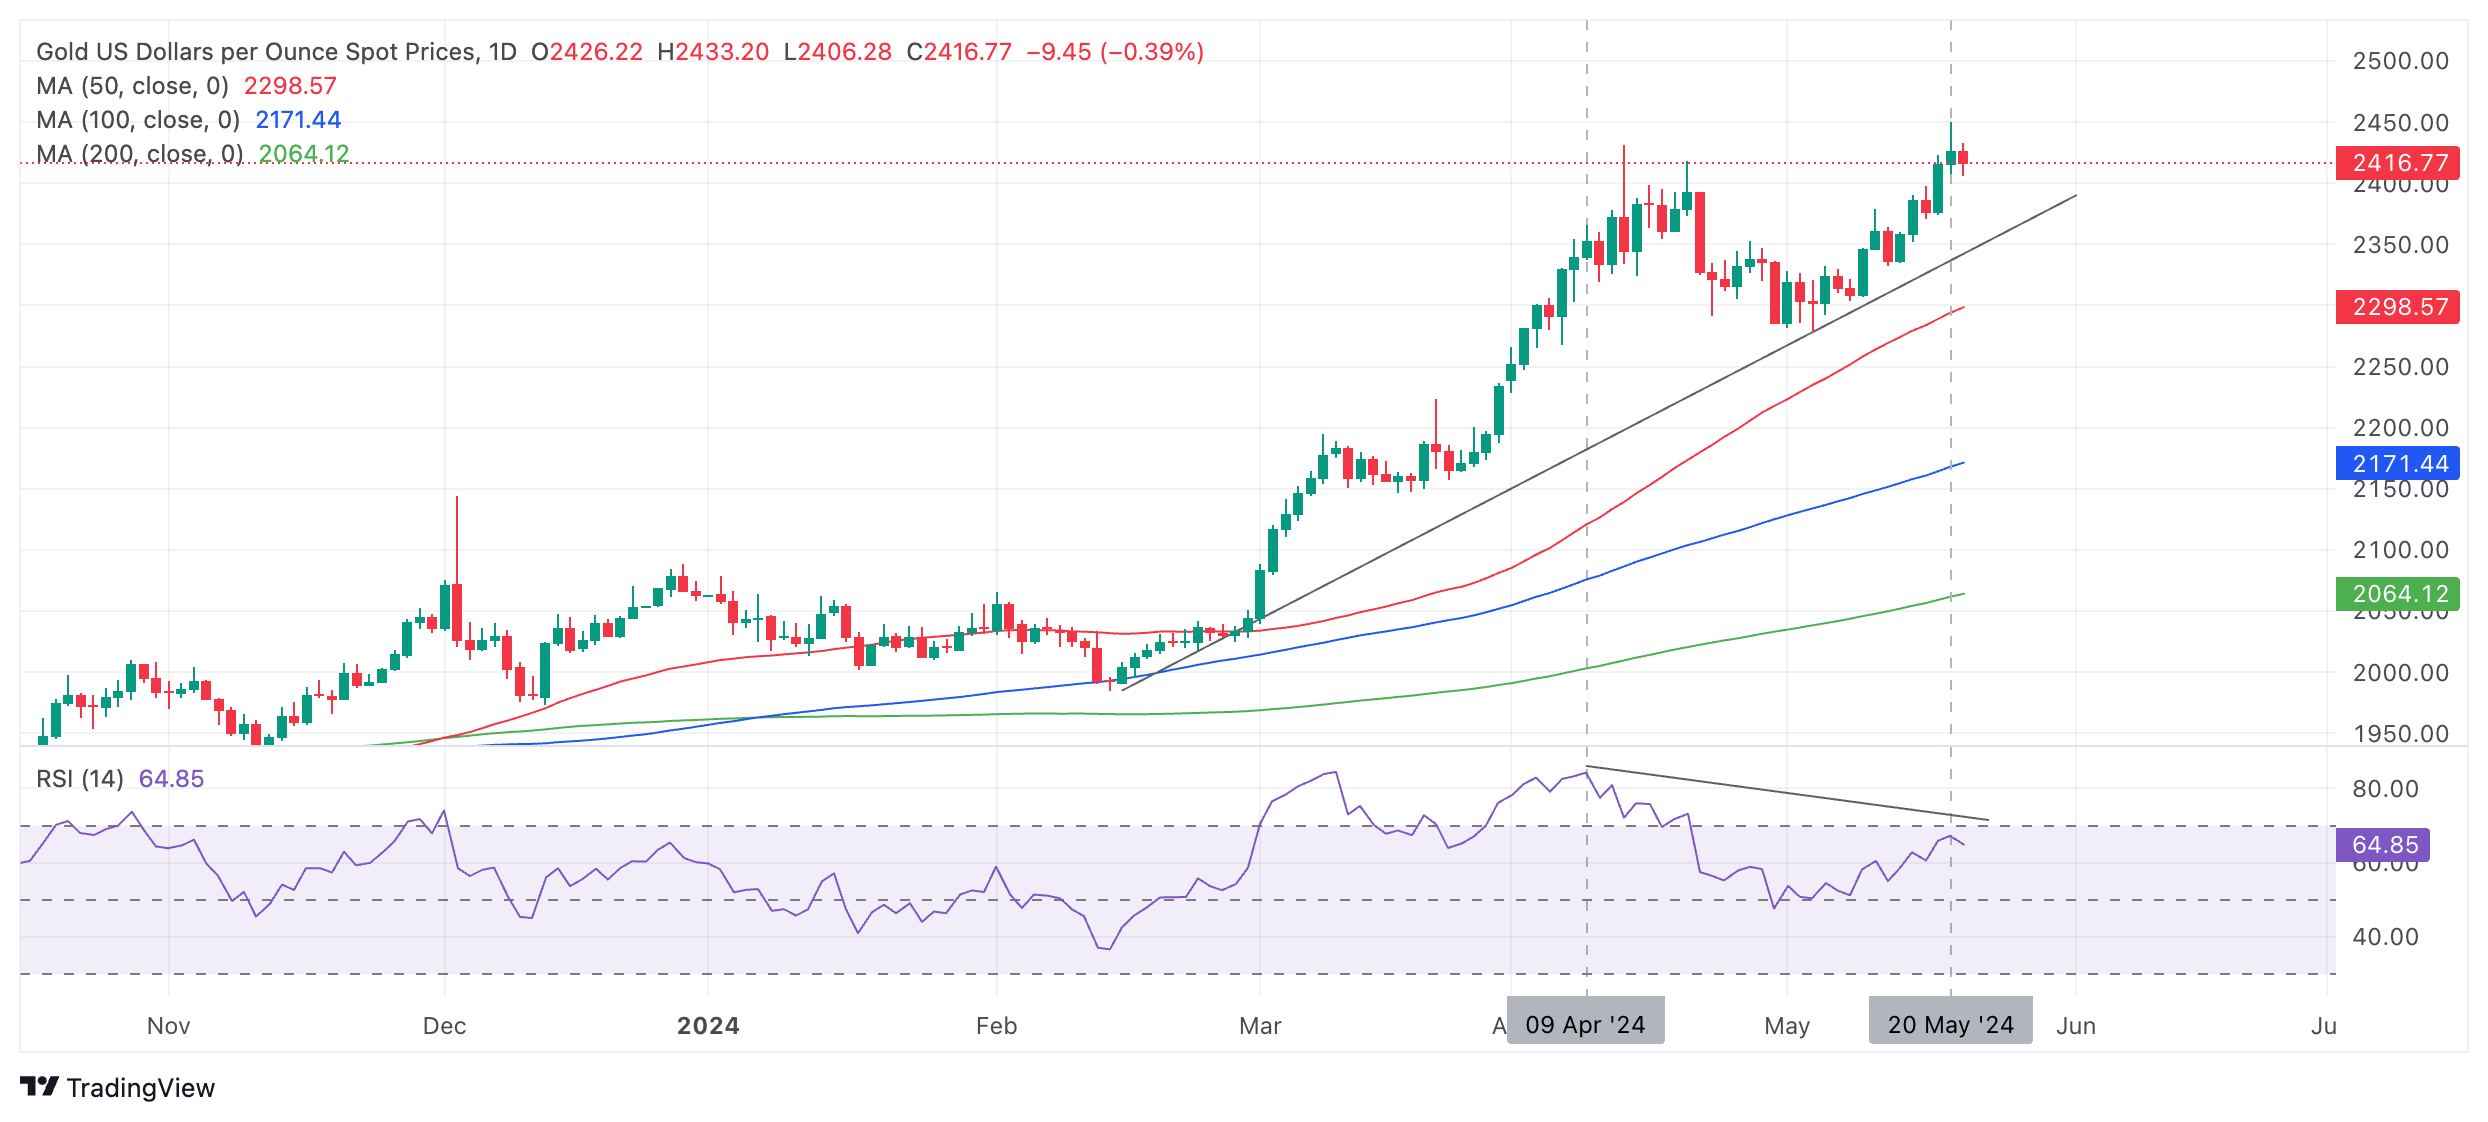
The Relative Strength Index (RSI) momentum indicator shows acute bearish divergence with price on the daily chart, providing further evidence that a correction may be about to unfold. Although the Gold price rose above the April 12 peak to make a higher high on May 20, the RSI failed to make a higher high. This is a bearish indication, suggesting a greater chance of a pull-back evolving.
If a correction unfolds, Gold will probably fall to support at the upward-sloping trendline in the $2,360s.
However, the precious metal’s short-medium and long-term trends are bullish, and given the old adage that “the trend is your friend”, the odds favor an eventual recovery even if there is a correction.
A break above the new $2,450 all-time high would likely continue the rally to the next target at the psychologically significant $2,500 level.
Gold FAQs
Gold has played a key role in human’s history as it has been widely used as a store of value and medium of exchange. Currently, apart from its shine and usage for jewelry, the precious metal is widely seen as a safe-haven asset, meaning that it is considered a good investment during turbulent times. Gold is also widely seen as a hedge against inflation and against depreciating currencies as it doesn’t rely on any specific issuer or government.
Central banks are the biggest Gold holders. In their aim to support their currencies in turbulent times, central banks tend to diversify their reserves and buy Gold to improve the perceived strength of the economy and the currency. High Gold reserves can be a source of trust for a country’s solvency. Central banks added 1,136 tonnes of Gold worth around $70 billion to their reserves in 2022, according to data from the World Gold Council. This is the highest yearly purchase since records began. Central banks from emerging economies such as China, India and Turkey are quickly increasing their Gold reserves.
Gold has an inverse correlation with the US Dollar and US Treasuries, which are both major reserve and safe-haven assets. When the Dollar depreciates, Gold tends to rise, enabling investors and central banks to diversify their assets in turbulent times. Gold is also inversely correlated with risk assets. A rally in the stock market tends to weaken Gold price, while sell-offs in riskier markets tend to favor the precious metal.
The price can move due to a wide range of factors. Geopolitical instability or fears of a deep recession can quickly make Gold price escalate due to its safe-haven status. As a yield-less asset, Gold tends to rise with lower interest rates, while higher cost of money usually weighs down on the yellow metal. Still, most moves depend on how the US Dollar (USD) behaves as the asset is priced in dollars (XAU/USD). A strong Dollar tends to keep the price of Gold controlled, whereas a weaker Dollar is likely to push Gold prices up.
Recommended Articles


