

Ethereum Beats BTC as $1 Billion Whale Buying Lifts Breakout Odds Despite Pullback Risks
Ethereum price is showing strength even as the broader crypto market remains mostly flat. Over the past seven days, Ethereum has gained nearly 14%, outperforming Bitcoin (up 7%) and signaling strong demand.
Even in the last 24 hours, Ethereum has held steady with slight gains. This shows buyers are still active after a sharp rally. At first glance, the answer seems simple. Ethereum whales have added more than $1 billion worth of ETH in a short time. But while this explains part of the move, the charts suggest a bigger setup is unfolding beneath the surface.
Price Leans Bullish, But Leadership Spike Signals Familiar Risk
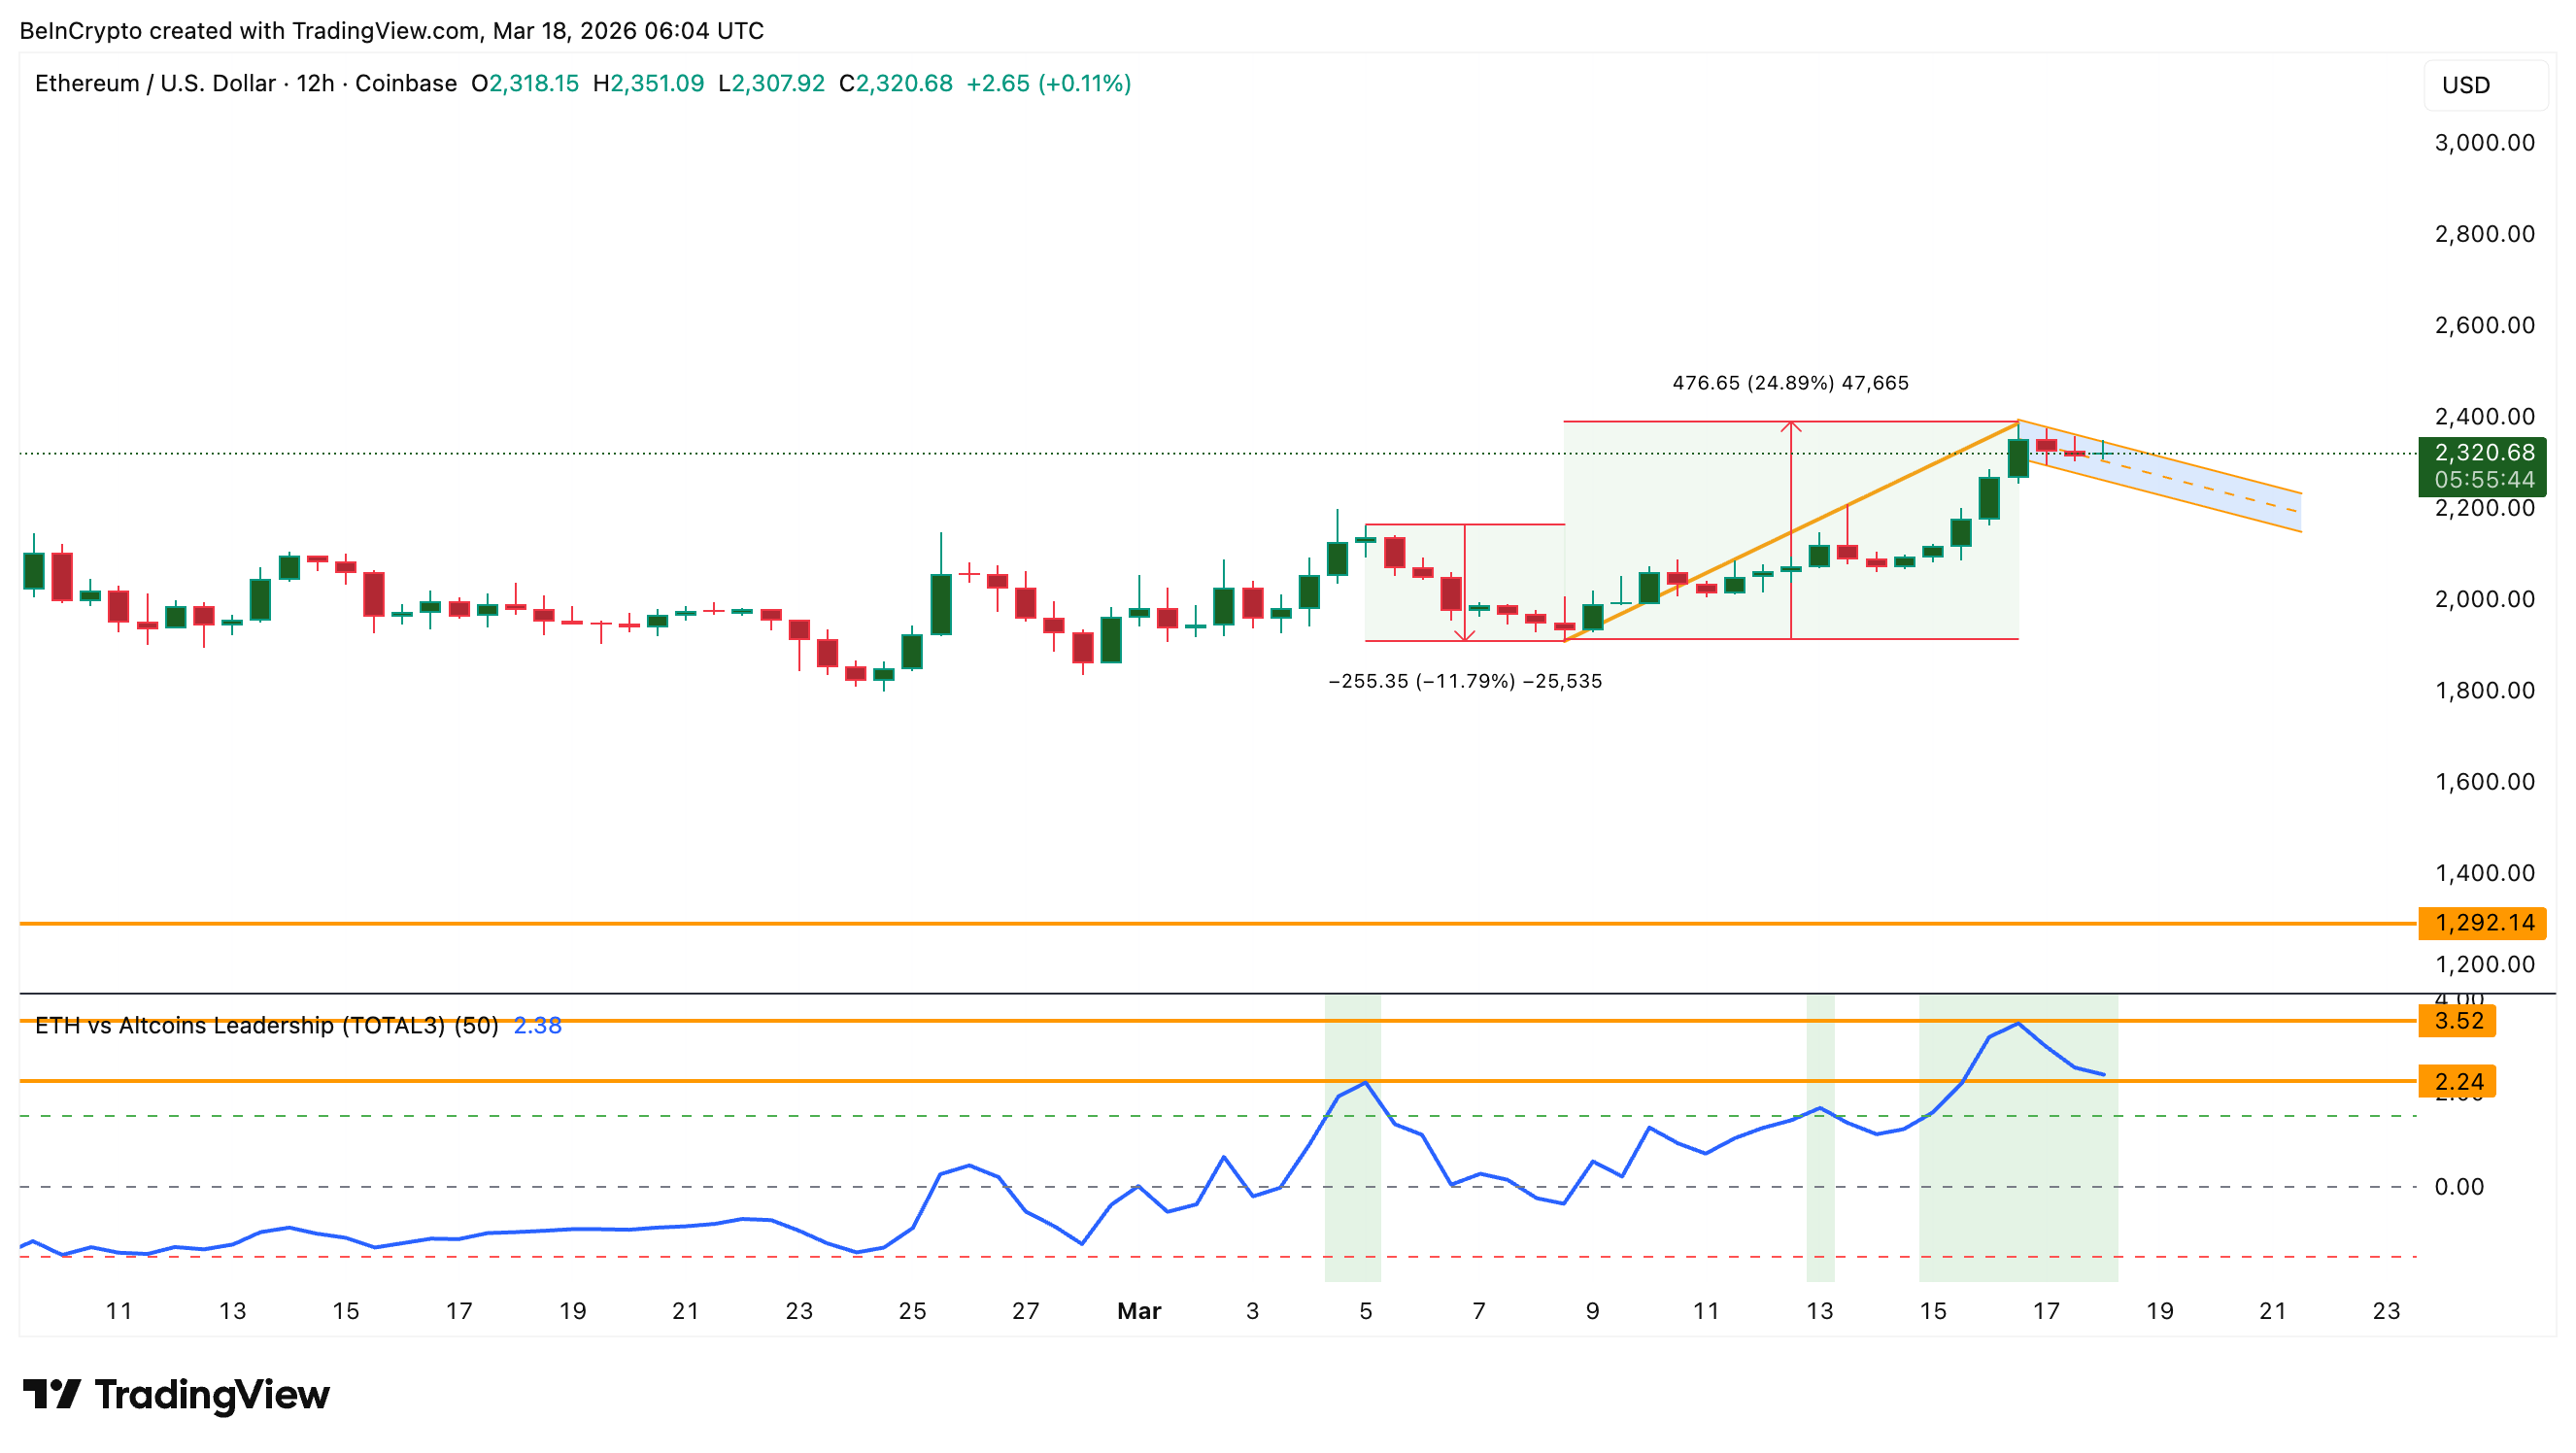
On the 12-hour chart, Ethereum price is forming a bullish continuation pattern known as a bull flag. The move of nearly 25% formed the pole earlier. The current sideways structure forms the flag. However, this strength comes with a familiar signal that cannot be ignored.
BeInCrypto’s Ethereum leadership model compares Ethereum against the rest of the altcoin market using TOTAL3. TOTAL3 represents the total crypto market cap excluding Bitcoin and Ethereum, making it a cleaner way to measure Ethereum’s relative position within the altcoin space.
The model tracks the ratio between Ethereum price and TOTAL3, and then applies a Z-score to that ratio. In simple terms, it shows whether Ethereum is outperforming or lagging the rest of the market.
Right now, that Z-score has pushed above 2 and recently peaked near 3.5, showing strong outperformance to all the other altcoins.
 ETH Pattern And TOTAL3 Comparison: TradingView
In early March, when the Z-score crossed similar levels near 2.2, Ethereum saw a pullback of nearly 12% before continuing higher. That means strong leadership often leads to short-term exhaustion; a move some X folks are positioning for.
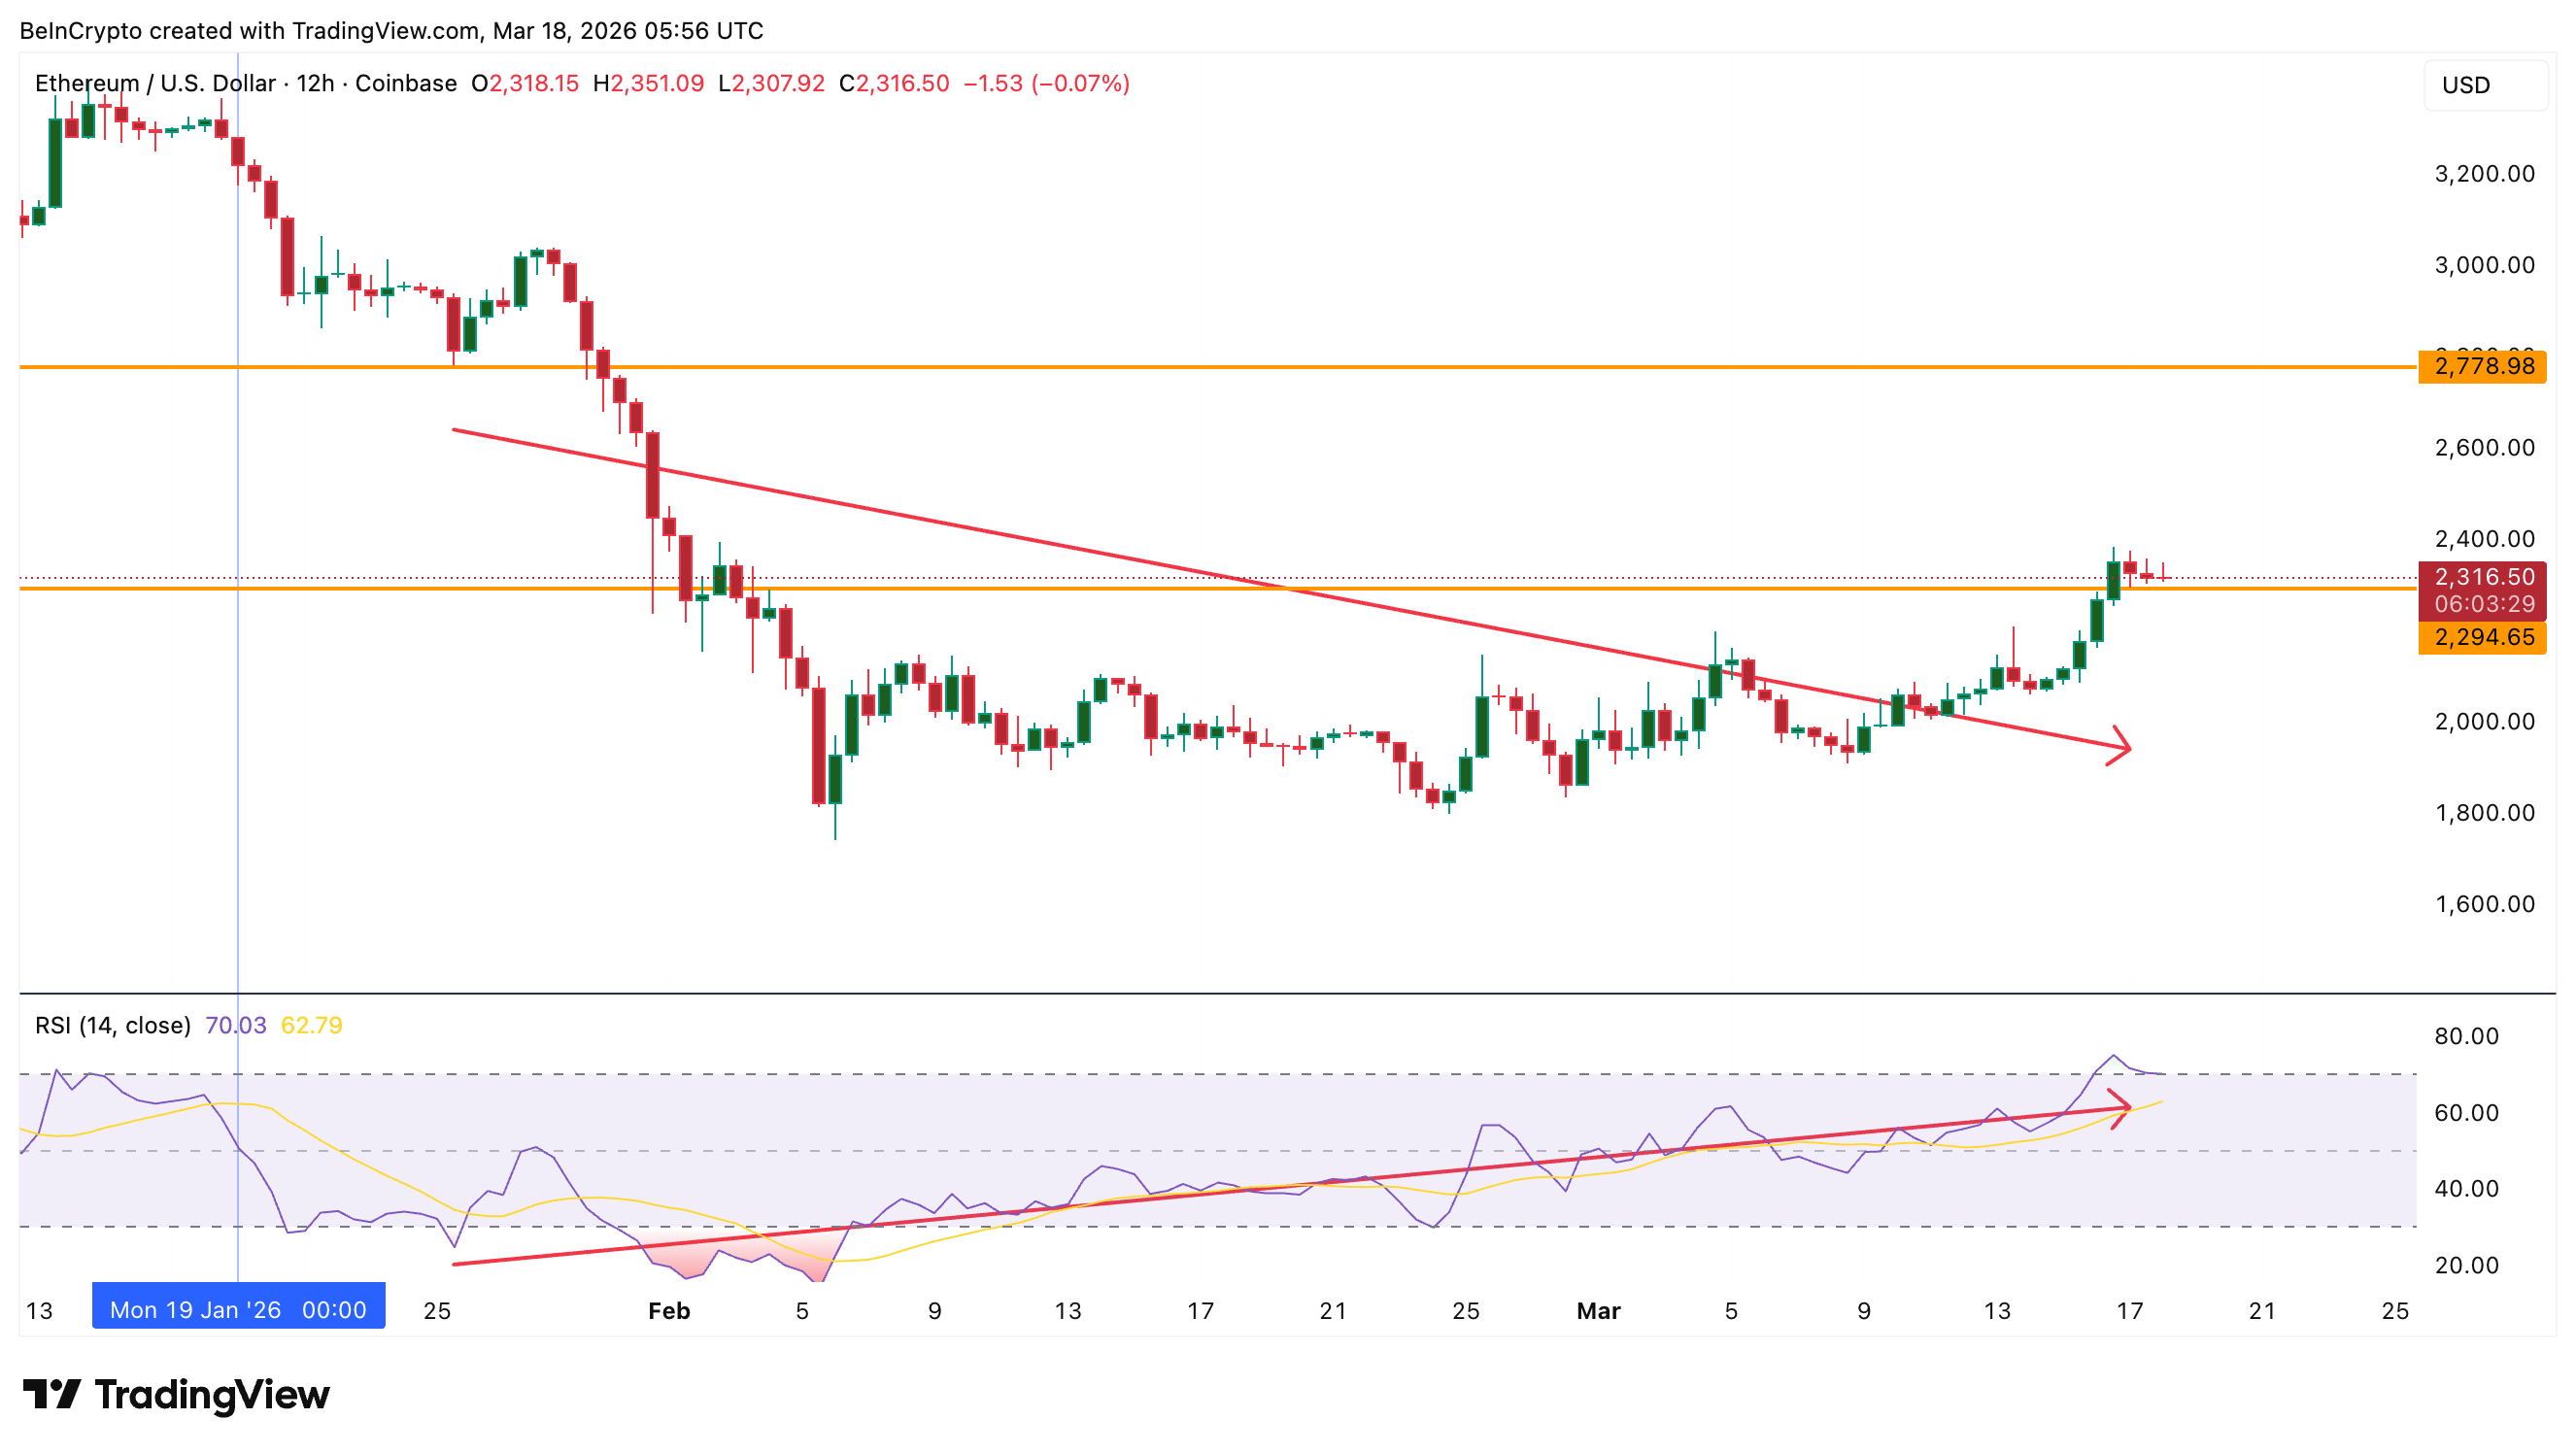
At the same time, momentum is beginning to support a potential upside shift. On the 12-hour chart, the Relative Strength Index (RSI), a momentum indicator, is forming higher lows between January 26 and March 17, even as the Ethereum price formed lower lows during the same period.
 Bullish RSI: TradingView
This is known as bullish divergence, where momentum improves while price remains trending lower. Despite Ethereum still being down over 20% year-to-date, this pattern suggests that selling pressure has been gradually weakening.
In simple terms, the broader trend remains negative, but momentum has started to turn. This creates a setup where a reversal or extended rally becomes possible, even if short-term pullbacks occur.
Ethereum Whales Step In, Changing the Usual Pullback Setup
This is where the whale activity becomes important.
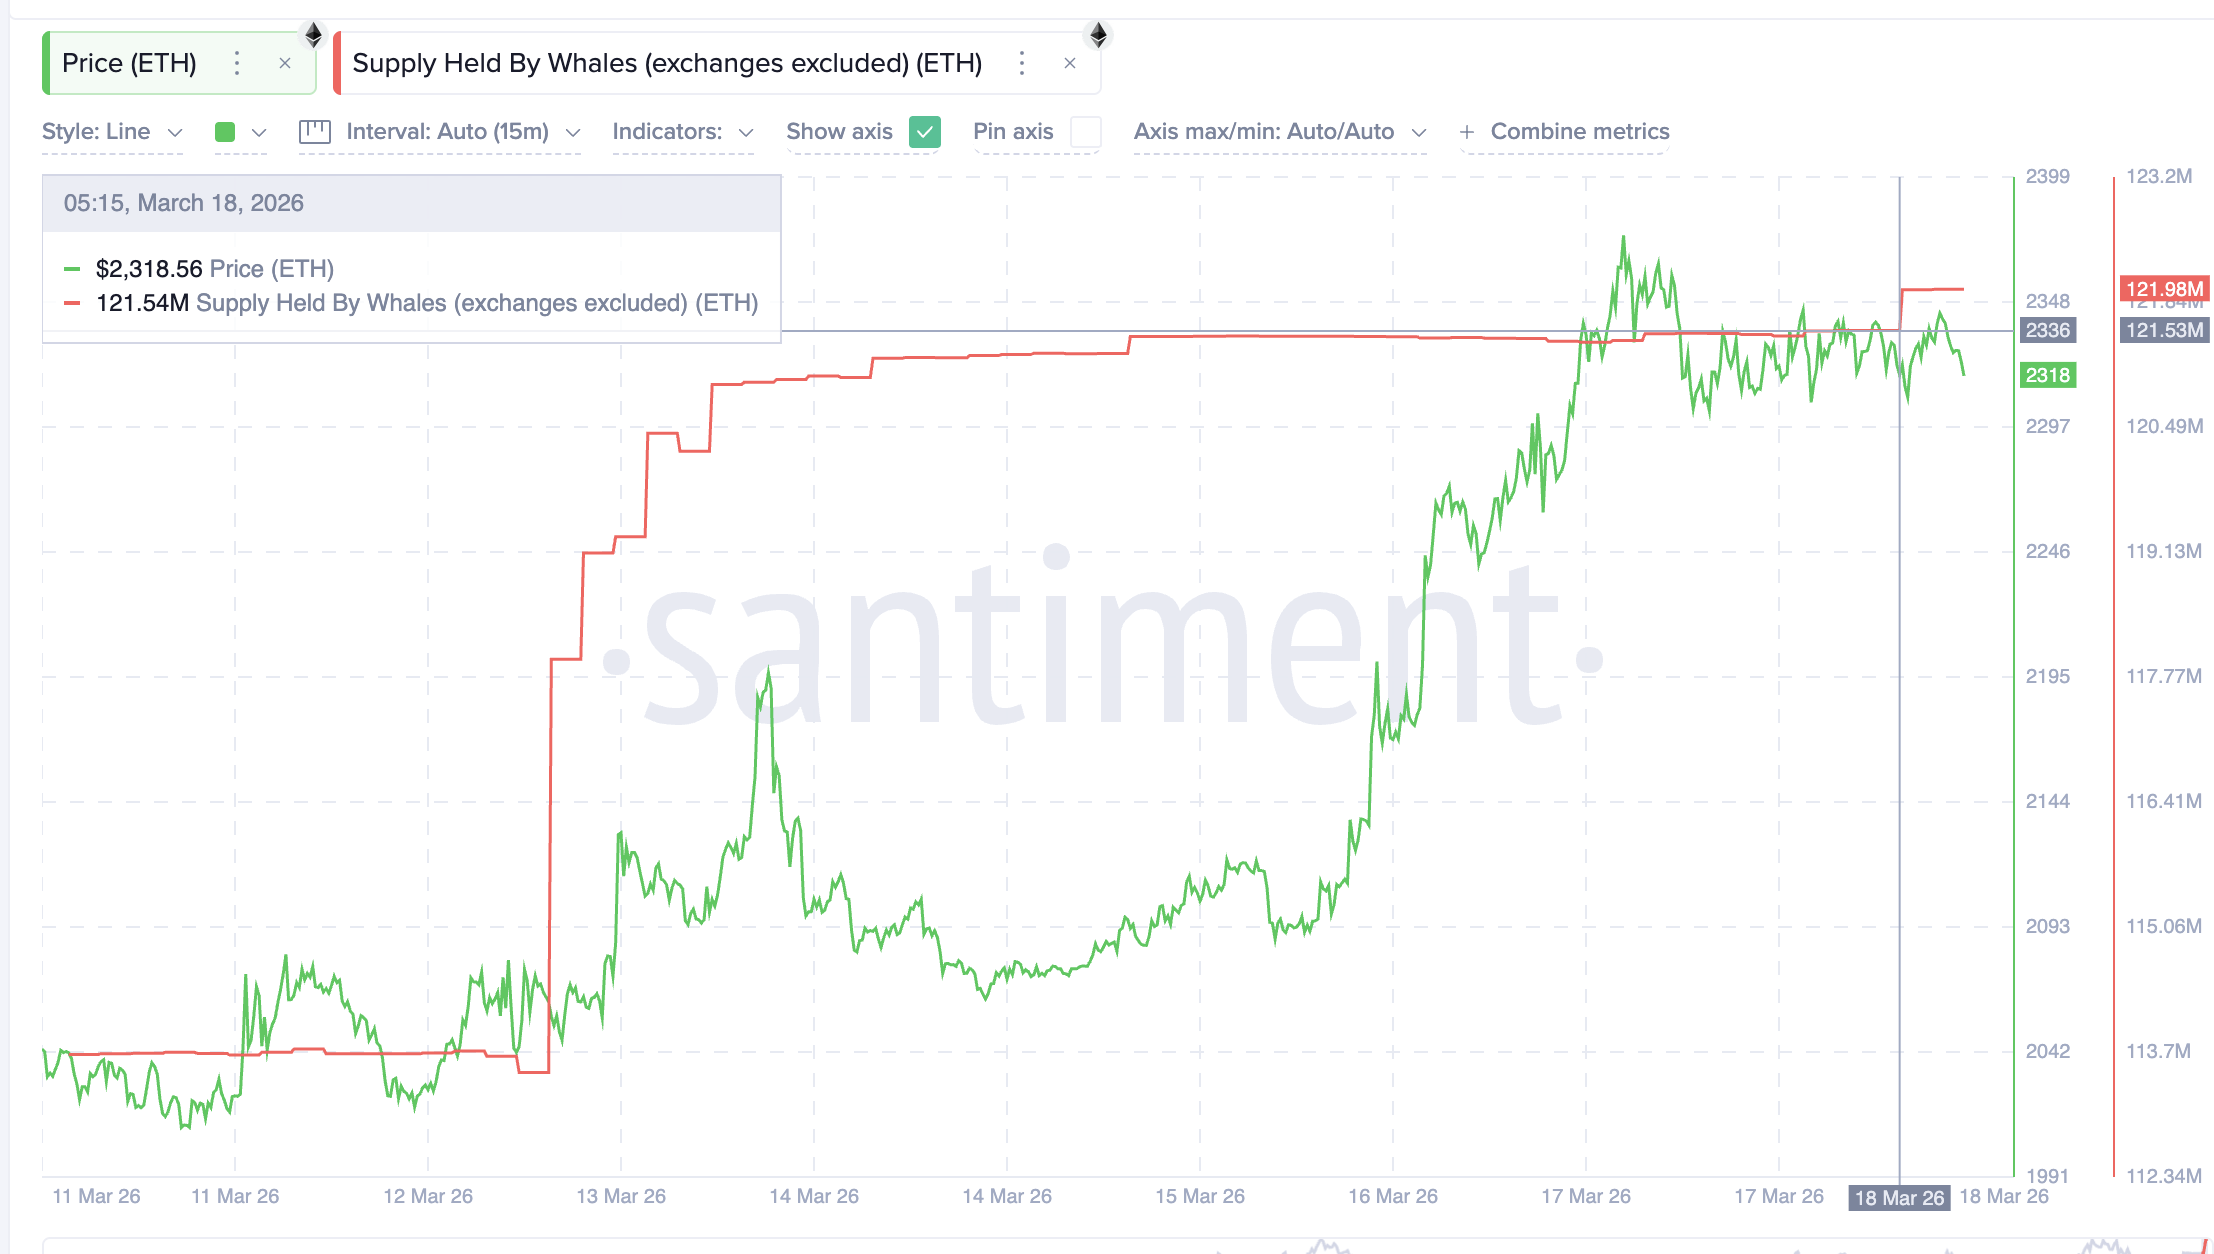
On-chain data shows that large holders have added significantly to their Ethereum positions. The supply held by whales, excluding exchanges, has increased from 121.53 million ETH to 121.98 million ETH in a short period.
That means roughly 450,000 ETH has been added, worth over $1 billion at current prices. More importantly, this is not a random accumulation.
Want more token insights like this? Sign up for Editor Harsh Notariya’s Daily Crypto Newsletter here.
 Whales Add: Santiment
Whale holdings had already been rising earlier, with a noticeable increase from March 12 to March 13. After a brief pause, another fresh spike in accumulation has now appeared. This timing matters because it comes right as Ethereum’s leadership Z-score peaked again. New whale-sized ETH purchases are also showing up with each passing hour.
In early March, when Ethereum showed similar leadership strength and later corrected, whale activity remained mostly flat. There was no strong accumulation to support the price during the pullback. Now, the setup looks different.
Ethereum is again showing strong leadership and facing a potential cooldown, but this time, whales are actively buying into that strength. This suggests that while a pullback may still happen, it may not be as deep or as prolonged. The presence of large buyers could absorb selling pressure and support the structure.
In simple terms, the same leadership signal is flashing, but the underlying demand has changed.
Key Ethereum Price Levels to Watch Now
With both signals in place, the next move depends on how Ethereum reacts at key levels.
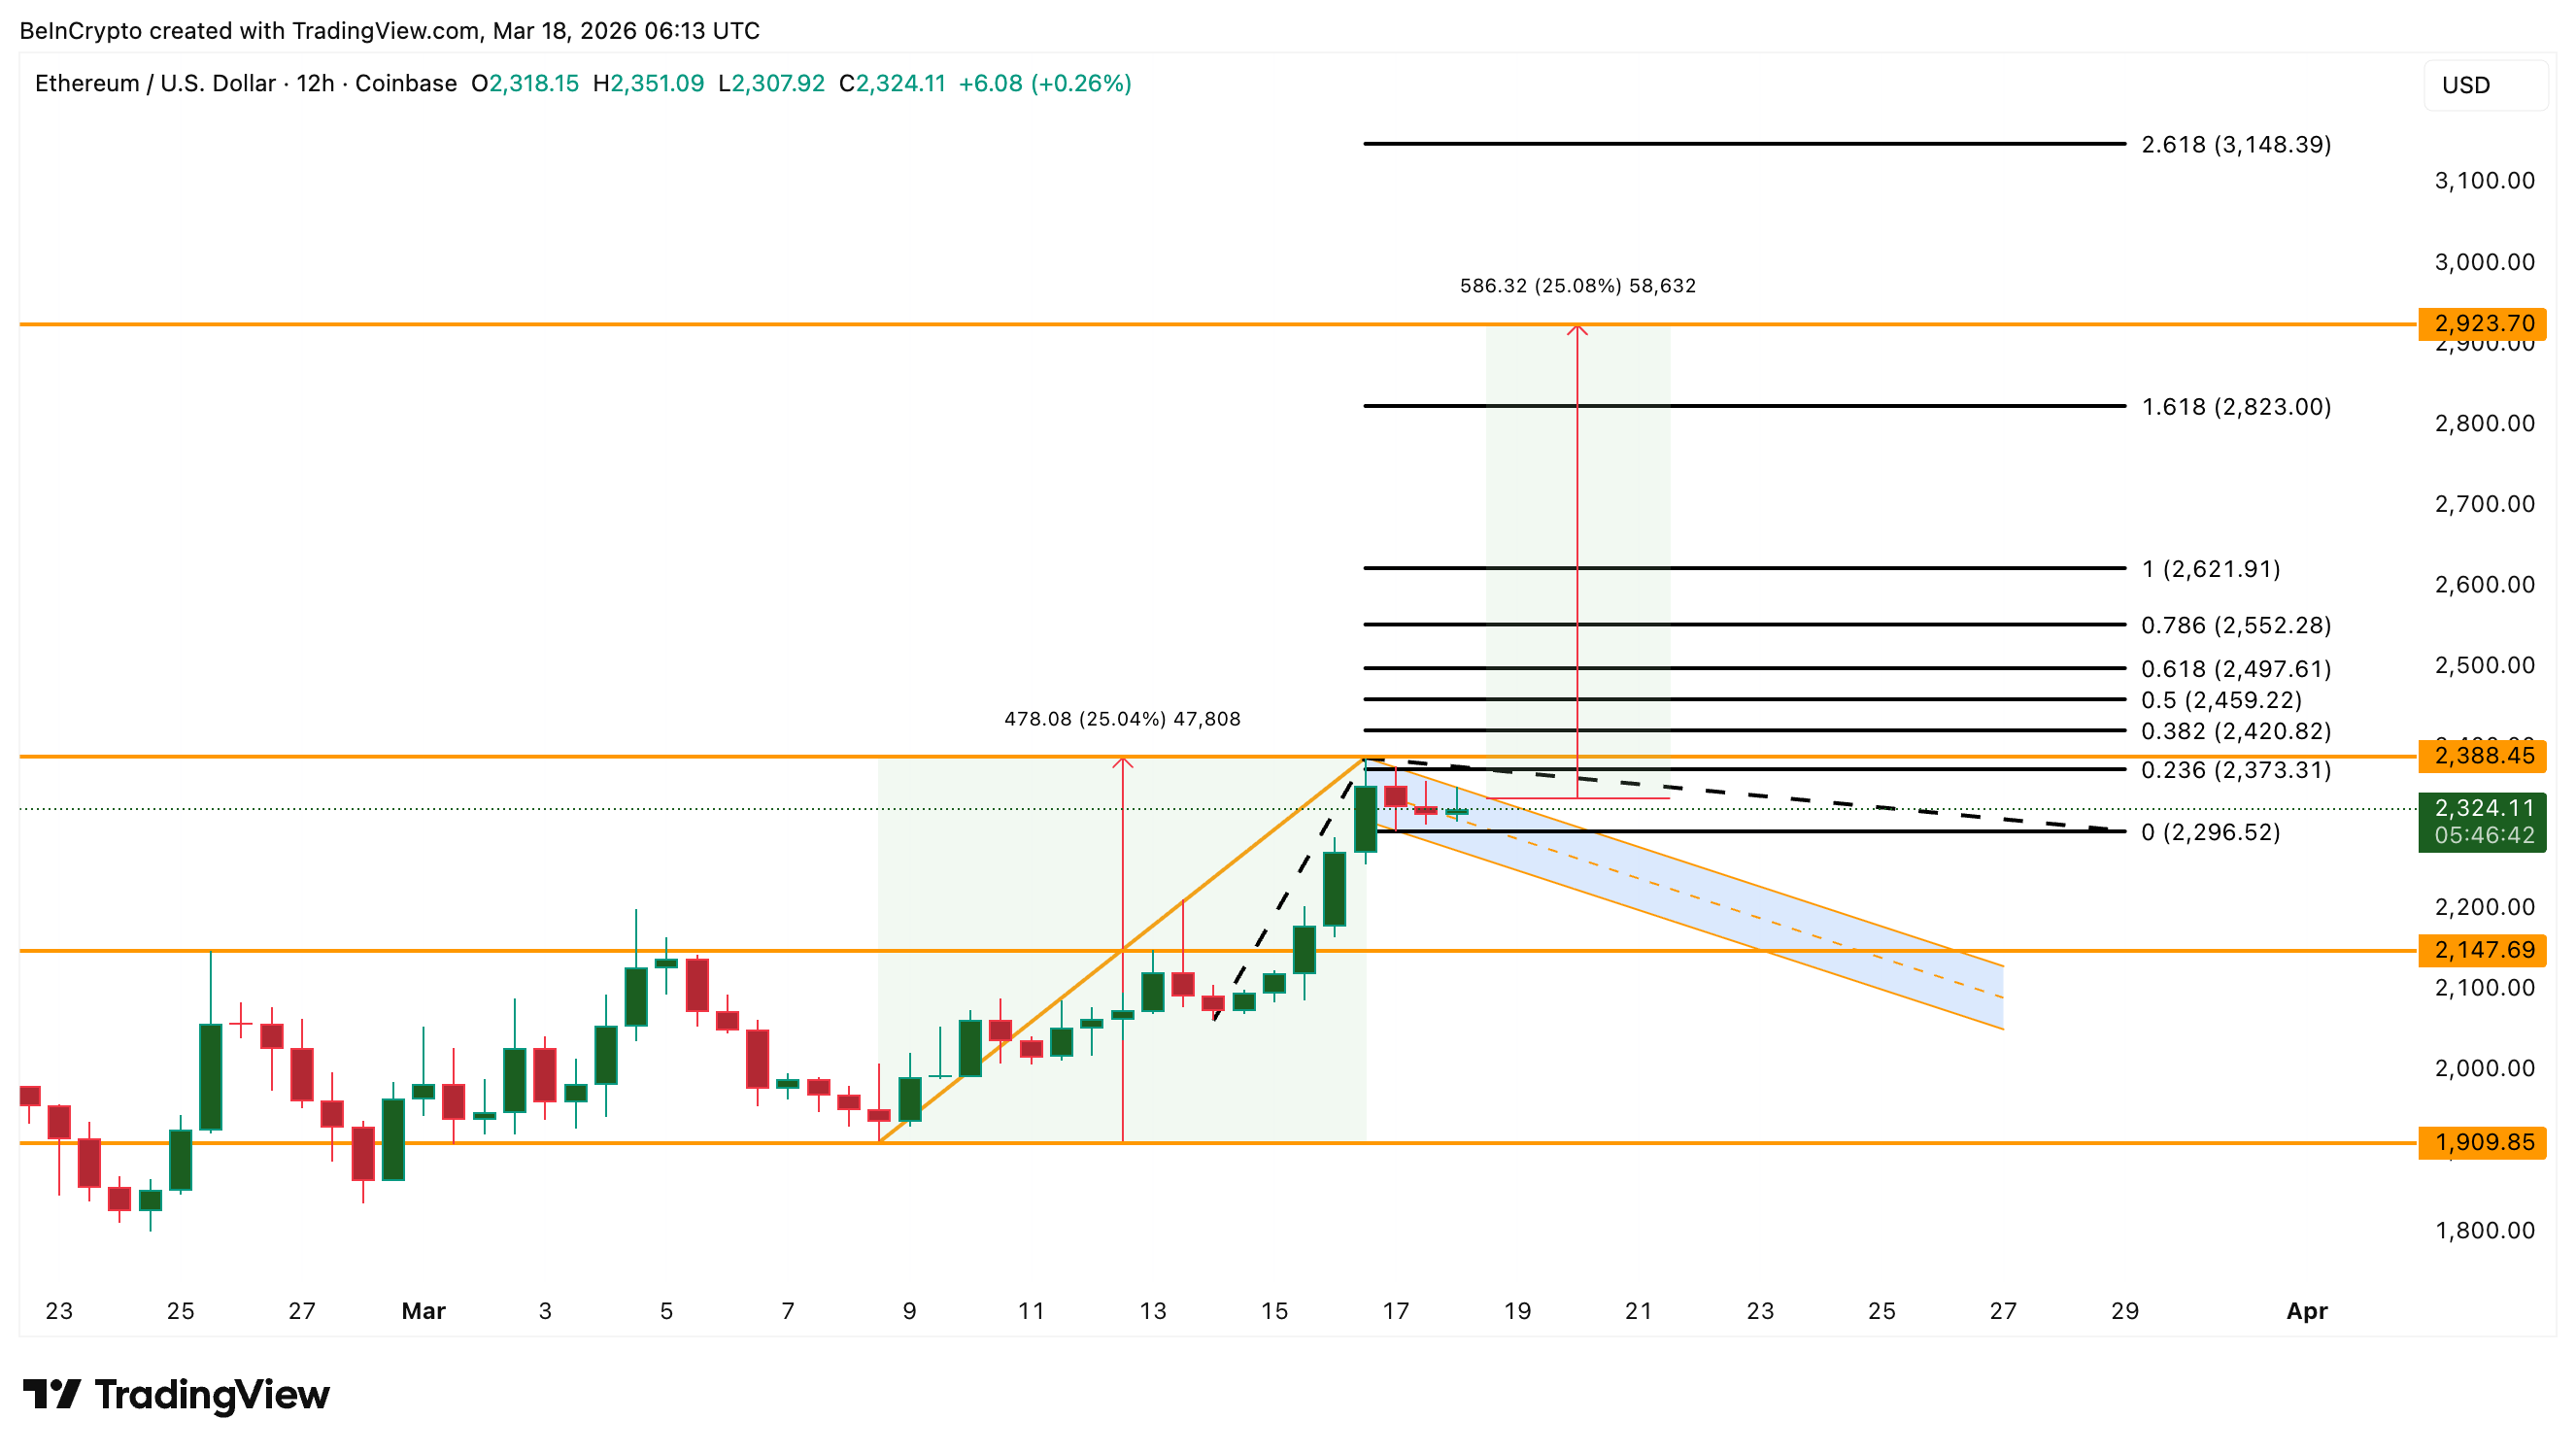
On the downside, $2,290 is the most important support. This level aligns with the lower boundary of the current structure. A 12-hour close below this level could weaken the bullish setup.
If that happens, the next levels to watch are $2,140 and $1,900. A move toward these levels would suggest a deeper correction, especially if the earlier 12% pullback pattern repeats.
On the upside, Ethereum needs to break above the $2,370 to $2,380 range. This marks the upper boundary of the bull flag, where a breakout would confirm continuation.
 ETH Price Analysis: TradingView
Based on the earlier 25% move, the next upside targets could fall between $2,820 and $2,920, depending on where the breakout happens. If momentum remains strong, extended targets near $3,140 may also come into play.
Putting everything together, the Ethereum price is at a critical point. Strong leadership and bullish structure support further upside, but the same leadership also signals short-term exhaustion risk. The key difference this time is whale activity.
If accumulation continues, it could support the trend and limit downside, allowing Ethereum to move higher after a brief pause.
Recommended Articles


