Silver Price Analysis: XAG/USD gains marginally, clings above $28.00

Source Fxstreet
  • Silver prices climb due to a weaker US Dollar and lower US yields.
  • Traders await key inflation data from the US and Fed Chair Powell's speech.
  • Momentum favors bulls, but a daily close below $28.00 and Silver could dip toward $27.00, short-term.

Silver's price advanced 0.28% on Monday, courtesy of falling yields in US Treasuries and a softer US Dollar. A scarce economic schedule in the US keeps investors bracing for releasing the Consumer Price Index (CPI) on May 15, but first, traders will deal with Fed Chair Jerome Powell's speech on Tuesday. The XAG/USD trades at $28.22 after hitting a low of $27.97.

XAG/USD Price Analysis: Technical outlook

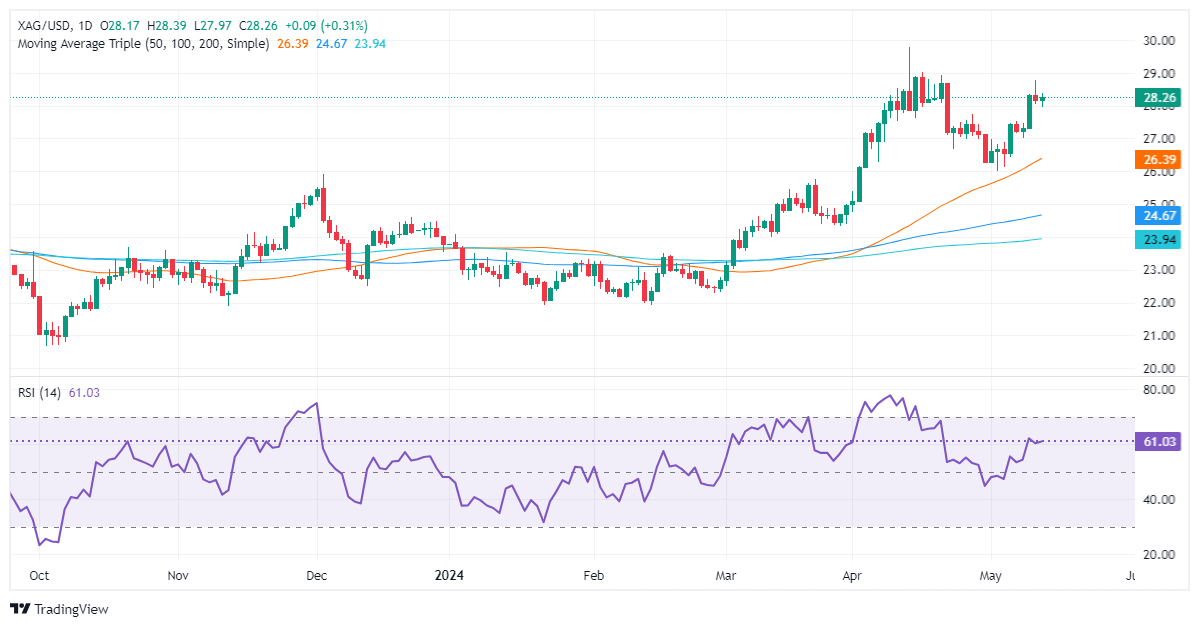
After peaking at around $28.74 last week, Silver dipped toward the $28.00 figure before reversing its course and shifting positively during the day. However, the grey metal remains below the June 10, 2021, high of $28.28, which could open the door for a pullback.

Momentum, as measured by the Relative Strength Index (RSI), favors the XAG/USD bulls, but a daily close below $28.00 could pave the way for further losses.

In that outcome, the XAG/USD first support would be the 38.2% Fib retracement at $27.70, followed by April’s 15 low of $27.59. Once cleared, the next stop would be the 50% Fib retracement at $27.06.

On the other hand, if Silver stays above $28.00, that could open the door for a bullish continuation. The first resistance would be May 10, high at $28.76. Once cleared, key resistance levels surface, like the $29.00 figure, followed by the year-to-date (YTD) high of $29.79.

XAG/USD Price Action – Daily Chart

XAG/USD

Overview
Today last price 28.26
Today Daily Change 0.09
Today Daily Change % 0.32
Today daily open 28.17
 
Trends
Daily SMA20 27.51
Daily SMA50 26.28
Daily SMA100 24.63
Daily SMA200 23.92
 
Levels
Previous Daily High 28.77
Previous Daily Low 28.04
Previous Weekly High 28.77
Previous Weekly Low 26.44
Previous Monthly High 29.8
Previous Monthly Low 24.75
Daily Fibonacci 38.2% 28.32
Daily Fibonacci 61.8% 28.49
Daily Pivot Point S1 27.88
Daily Pivot Point S2 27.6
Daily Pivot Point S3 27.16
Daily Pivot Point R1 28.61
Daily Pivot Point R2 29.05
Daily Pivot Point R3 29.34


Disclaimer: For information purposes only. Past performance is not indicative of future results.
placeholder
Ethereum (ETH) Price Closes Above $3,900 — Is a New All-Time High Possible Before 2024 Ends?Once again, the price of Ethereum (ETH) has risen above $3,900. This bounce has hinted at a further price increase for the altcoin before the end of the year.
Author  Beincrypto
Dec 17, 2024
Once again, the price of Ethereum (ETH) has risen above $3,900. This bounce has hinted at a further price increase for the altcoin before the end of the year.
placeholder
Pi Network Price Annual Forecast: PI Heads Into a Volatile 2026 as Utility Questions Collide With Big UnlocksPi Network heads into 2026 after a 90%+ 2025 drawdown from $3.00, with 17.5 million KYC users and a smart-contract-focused Stellar v23 upgrade offering upside potential, but 1.21 billion tokens unlocking and heavy exchange deposits (437 million PI) keeping supply pressure and trust risks firmly in focus.
Author  Mitrade
Dec 19, 2025
Pi Network heads into 2026 after a 90%+ 2025 drawdown from $3.00, with 17.5 million KYC users and a smart-contract-focused Stellar v23 upgrade offering upside potential, but 1.21 billion tokens unlocking and heavy exchange deposits (437 million PI) keeping supply pressure and trust risks firmly in focus.
placeholder
ECB Policy Outlook for 2026: What It Could Mean for the Euro’s Next MoveWith the ECB likely holding rates steady at 2.15% and the Fed potentially extending cuts into 2026, EUR/USD may test 1.20 if Eurozone growth proves resilient, but weaker growth and an ECB pivot could pull the pair back toward 1.13 and potentially 1.10.
Author  Mitrade
Dec 26, 2025
With the ECB likely holding rates steady at 2.15% and the Fed potentially extending cuts into 2026, EUR/USD may test 1.20 if Eurozone growth proves resilient, but weaker growth and an ECB pivot could pull the pair back toward 1.13 and potentially 1.10.
placeholder
My Top 5 Stock Market Predictions for 2026Five 2026 market predictions written in a native, news-style voice: AI’s winners and losers, broader sector leadership, dividend demand, valuation cooling as the Shiller CAPE sits at 39 (Dec. 31, 2025), and quantum-computing bursts—while keeping all original facts and numbers unchanged.
Author  Mitrade
Jan 06, Tue
Five 2026 market predictions written in a native, news-style voice: AI’s winners and losers, broader sector leadership, dividend demand, valuation cooling as the Shiller CAPE sits at 39 (Dec. 31, 2025), and quantum-computing bursts—while keeping all original facts and numbers unchanged.
placeholder
WTI recovers to near $86.50 as Strait of Hormuz remains closedWest Texas Intermediate (WTI), the US crude oil benchmark, is trading around $86.40 during the early Asian trading hours on Tuesday. The WTI price faces extreme volatility following a massive spike to nearly $120 per barrel in the previous session. 
Author  FXStreet
Mar 10, Tue
West Texas Intermediate (WTI), the US crude oil benchmark, is trading around $86.40 during the early Asian trading hours on Tuesday. The WTI price faces extreme volatility following a massive spike to nearly $120 per barrel in the previous session. 
Related Instrument
goTop
quote