

Oil edges up as US inventories decline to lowest level since January
- Oil briefly spikes after US weekly EIA data showed a big decline in stockpiles.
- WTI Oil snaps $83, but faces resistance to break back above it again.
- The US Dollar Index retreats further, forming a bearish pattern.
Oil prices edge up on Thursday as traders digest the US Crude Inventory release, which was taken as bullish for near-term prices. Overall, the release showed a chunky draw of 6.368 million barrels, which puts the US inventory at its lowest level since January 19 by 453.6 million barrels. This might trigger some buying from the US Energy Department in order to build up stockpiles again ahead of the next heating season.
The US Dollar Index (DXY) has fallen in a bearish pattern. For a third day in a row, the index is posting lower highs and lower lows on the daily chart. This could point to a gruesome correction ahead, and with preliminary US Gross Domestic Product (GDP) release on Thursday and the Personal Consumption Expenditures (PCE) Price Index on Friday, catalysts are enough to trigger that breakdown.
Crude Oil (WTI) trades at $82.71 and Brent Crude at $87.11 at the time of writing.
Oil news and market movers: Restocking
- Fuel distillate Inventories (gasoil and jet fuel) at the Asian distribution hub of Singapore rose to the highest level since July 2021, according to official data released Thursday, Bloomberg reports.
- Chinese refiners are heading to Venezuela for cheap Oil. Venezuela is offering the discount after the US reimposed sanctions on the South American country.
- Some more details on the Crude stockpile number from the Energy Information Administration (EIA):
- US Gulf Coast refineries are processing the most crude since 2019 ahead of the summer driving season.
- The 6.368 million barrel drawdown in US crude inventories was unexpected – consensus was for a 1.6 million barrel buildup – as refineries ramp up Oil processing following maintenance and exports pick up.
- US Exports ticked above 5 million barrels a day amid robust outflow to Europe.
Oil Technical Analysis: US shooting itself in the foot
Oil prices are set for some buying pressure with US refiners and traders getting ready for the summer season. That always coincides with a lot of travel, be it via airspace (flights) or car (gasoline). With the recent chunky drawdown and nearly lowest level for the year in Crude stockpiles, refiners might ramp up prices.
With geopolitical tensions lingering and the US crude stockpile in low levels, the November 3 high at $83.34 and the $90 handle are the first key levels on the upside. One small barrier in the way is $89.64, the peak from October 20. In case of further escalating tensions, expect even September’s peak at $94 to become a possibility.
On the downside, the October 6 low at $80.63 is the next candidate as a pivotal support level. Below that level, the 55-day and the 200-day Simple Moving Averages (SMAs) at $80.37 and $79.67 should halt any further downturn.
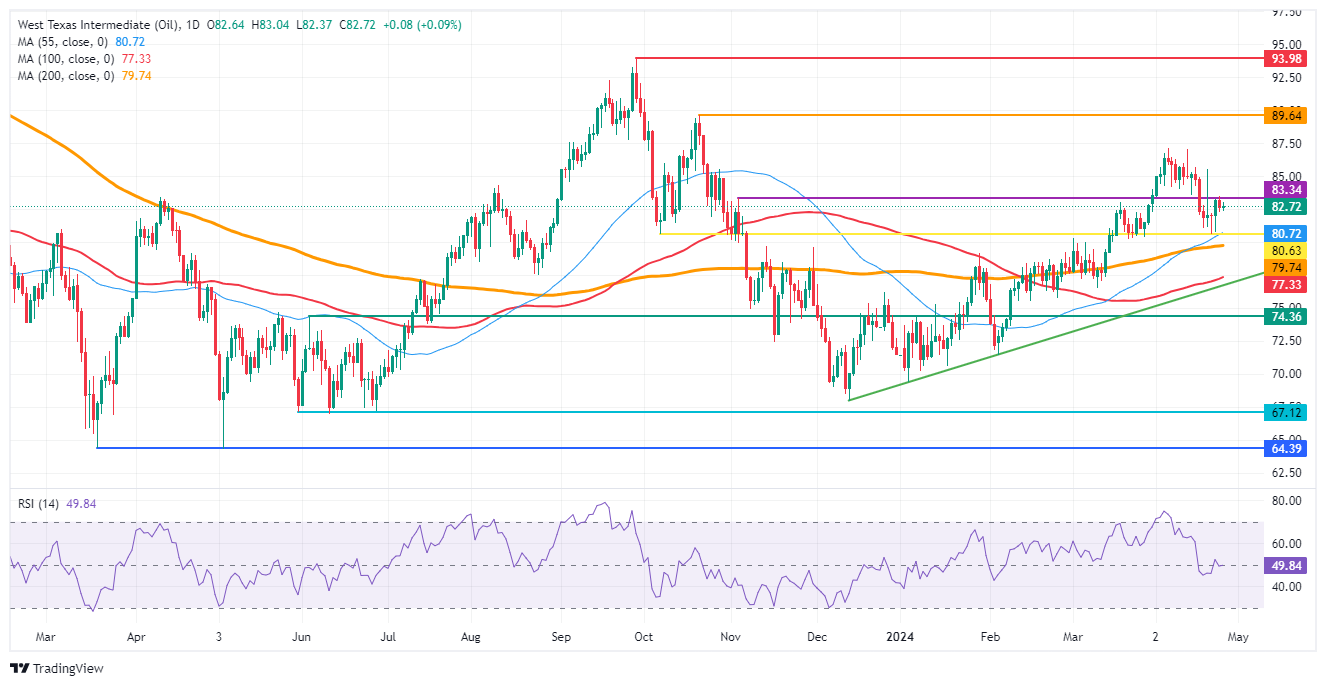
US WTI Crude Oil: Daily Chart
Recommended Articles


