Silver Price Forecast: XAG/USD recovers above $28.50 despite multiple tailwinds

Source Fxstreet
  • Silver price bounces back to $28.50 even though investors expect Middle East tensions won’t escalate further.
  • US bond yields rally amid uncertainty over Fed rate cut timing.
  • Upbeat US Retail Sales boost demand for the US Dollar.

Silver price (XAG/USD) finds strong buying interest near $27.50 after correcting from fresh highs of $29.80. The white metal rebounds to $28.50 in Monday’s American session but struggles to extend recovery as investors expect that Middle East tensions will not escalate further.

Iran said we don’t want to raise tensions in the Middle East further. Their administration added, “the matter deemed to be closed.” However, should the Israeli regime make another mistake, Iran’s response will be considerably more severe, the Wall Street Journal reported. Meanwhile, US President Joe Biden said it won’t support the counterattack from Israel. On Saturday, Iran launched hundreds of drones and missile on the Israeli state.

Meanwhile, higher bond yields due to deepening uncertainty about when the Federal Reserve (Fed) will pivot to rate cuts is barricading the Silver price from further upside. 10-year US Treasury yields rise to 4.65%.

The US Dollar Index (DXY) extends its upside to 106.20 after upbeat US Retail Sales data for March. The US Census Bureau reported that Retail Sales rose strongly by 0.7% from expectations of 0.3% but the pace was slower than the prior reading of 0.9%, upwardly revised from 0.6%.

Silver technical analysis

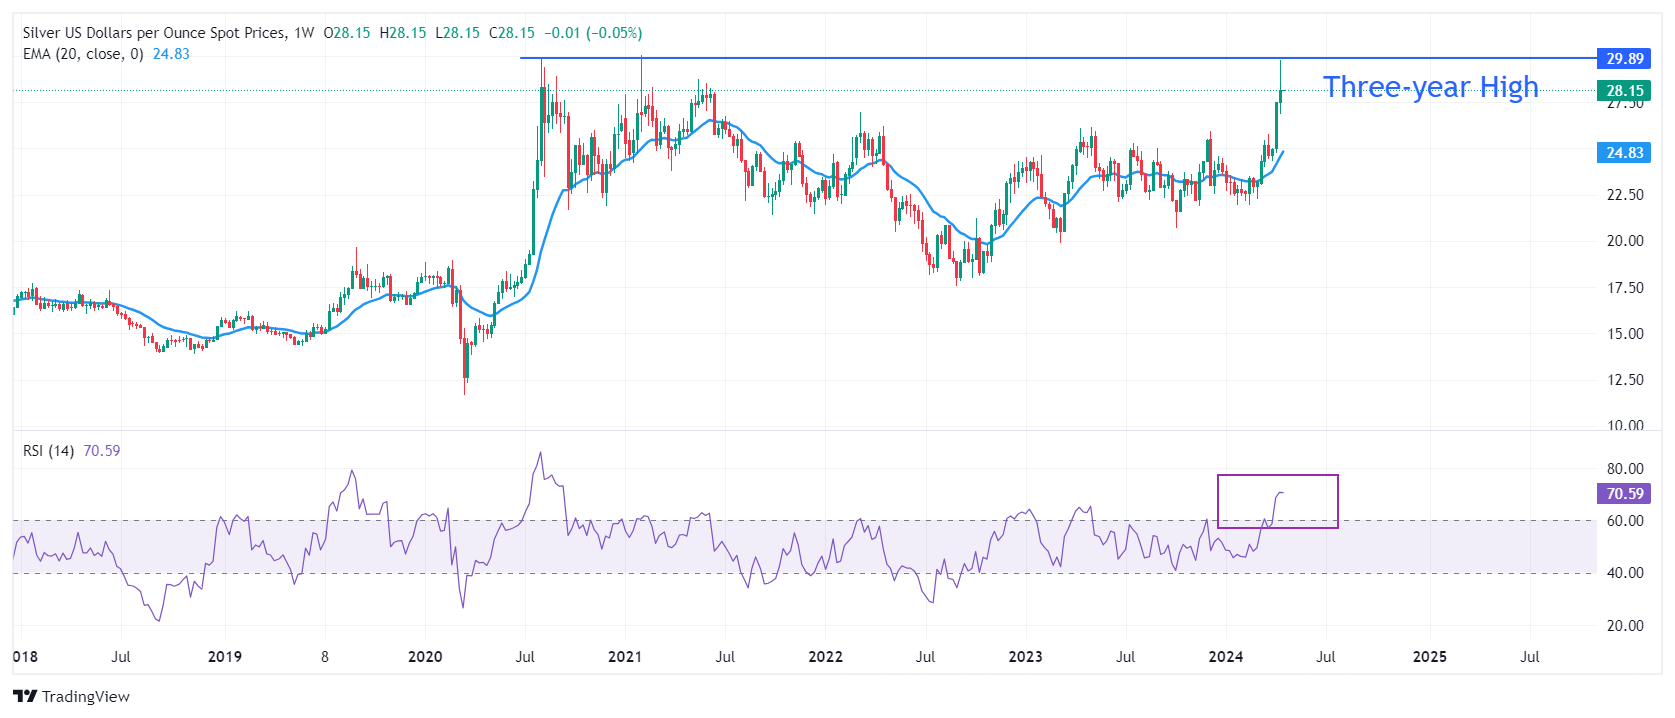
Silver price recaptures a three-year high near $30.00. The long-term outlook of the Silver price is extremely bullish as the 20-week Exponential Moving Average (EMA) near $25.00, is sloping higher. The 14-period Relative Strength Index (RSI) shifts into the bullish range of 60.00-80.00, suggesting that a bullish momentum is active.

Silver weekly chart

XAG/USD

Overview
Today last price 28.25
Today Daily Change 0.37
Today Daily Change % 1.33
Today daily open 27.88
 
Trends
Daily SMA20 26.1
Daily SMA50 24.34
Daily SMA100 23.95
Daily SMA200 23.6
 
Levels
Previous Daily High 29.8
Previous Daily Low 27.88
Previous Weekly High 29.8
Previous Weekly Low 26.88
Previous Monthly High 25.77
Previous Monthly Low 22.51
Daily Fibonacci 38.2% 28.61
Daily Fibonacci 61.8% 29.07
Daily Pivot Point S1 27.24
Daily Pivot Point S2 26.6
Daily Pivot Point S3 25.32
Daily Pivot Point R1 29.16
Daily Pivot Point R2 30.44
Daily Pivot Point R3 31.08


Disclaimer: For information purposes only. Past performance is not indicative of future results.
placeholder
Trump Blockade of Strait of Hormuz Drives Oil Price Surge, Will This Be Another TACO? On Sunday (April 13), Trump announced following the breakdown of U.S.-Iran negotiations that the U.S. Navy would impose a maritime blockade on Iranian ports starting Monday.Following the
Author  TradingKey
13 hours ago
On Sunday (April 13), Trump announced following the breakdown of U.S.-Iran negotiations that the U.S. Navy would impose a maritime blockade on Iranian ports starting Monday.Following the
placeholder
U.S.-Iran Standoff in the Strait of Hormuz. Iranian-Controlled Strait Has Not Resumed Passage; Why Does Trump Still Want a Military Blockade?Following the failure of U.S.-Iran peace talks, President Trump announced on Sunday that the U.S. Navy will immediately blockade the Strait of Hormuz and prevent any vessels that have pai
Author  TradingKey
20 hours ago
Following the failure of U.S.-Iran peace talks, President Trump announced on Sunday that the U.S. Navy will immediately blockade the Strait of Hormuz and prevent any vessels that have pai
placeholder
WTI jumps roughly 8% toward $100 as US blockades Strait of HormuzWest Texas Intermediate (WTI) – the US oil benchmark – has opened the week with a bullish gap, climbing roughly 8%, looking to retarget the $100 threshold.
Author  Mitrade
21 hours ago
West Texas Intermediate (WTI) – the US oil benchmark – has opened the week with a bullish gap, climbing roughly 8%, looking to retarget the $100 threshold.
placeholder
When Will Gold Rise Under the Pressure of High Oil Prices? On April 8, spot gold ( XAUUSD) at one point surged past $4,800 per ounce, hitting a peak of $4,857; however, it fell back to $4,698 on April 9, wiping out all gains in just 48 hours. Thi
Author  TradingKey
Apr 10, Fri
On April 8, spot gold ( XAUUSD) at one point surged past $4,800 per ounce, hitting a peak of $4,857; however, it fell back to $4,698 on April 9, wiping out all gains in just 48 hours. Thi
placeholder
WTI holds steady above $92.00 as Strait of Hormuz remains closed; bulls seem hesitant West Texas Intermediate (WTI) – the benchmark US Crude Oil price – trades with a mild positive bias during the Asian session on Friday, though it lacks bullish conviction amid hopes of Iran ceasefire stabilizing.
Author  FXStreet
Apr 10, Fri
West Texas Intermediate (WTI) – the benchmark US Crude Oil price – trades with a mild positive bias during the Asian session on Friday, though it lacks bullish conviction amid hopes of Iran ceasefire stabilizing.
Related Instrument
goTop
quote