WTI Crude Oil rebounds into $73.00 on supply drawdown expectations, rate cut hopes

Source Fxstreet
  • WTI climbed back into $73 per barrel, recovering ground from early week declines.
  • OPEC is set for further supply drawdowns in the face of renewed oversupply.
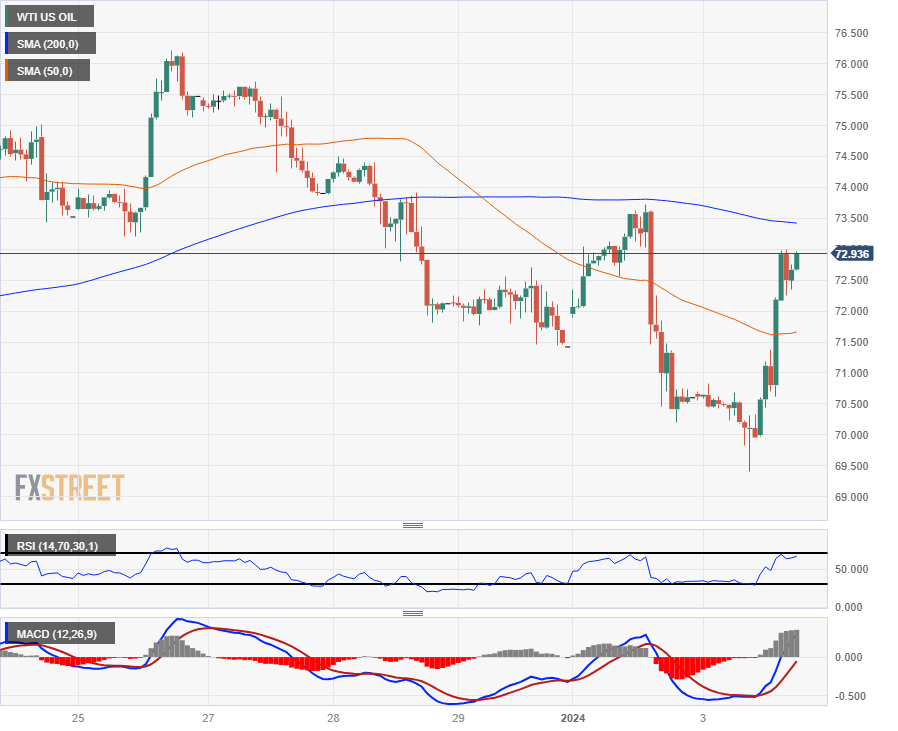
  • USD Crude Oil slumped to a two-week low of $69.50 before rallying 5%.

Further gains are on the cards for West Texas Intermediate (WTI) US Crude Oil after a recovery rally on Wednesday propped up barrel bids to retest the $73.00 handle as the Organization of the Petroleum Exporting Countries (OPEC) is set to bring about further production cuts in an effort to bolster flagging Crude Oil prices.

OPEC pumped an average of 28.05 barrels per day through December according to survey reporting by Bloomberg, and OPEC is expected to pursue an additional 900K bpd in production cuts, but energy markets remain unsure whether or not OPEC production caps will be enough to stave off Crude Oil oversupply from the US and other non-OPEC rivals.

Crude Oil continues to whipsaw amidst shaky production cuts

Many member nations of the 22-country OPEC+ extended alliance are already stretched to their breaking point on the amount of production cuts their government budgets can shoulder, and with OPEC lacking any mechanisms to reinforce production quotas or to punish members that flout production limits, Crude Oil traders remain concerned that production will continue to outpace slumping global crude demand.

OPEC+ will be holding a monitoring meeting to review activities in Crude Oil markets on February 1, to be followed up by a meeting of OPEC+ ministers in early June. Confidence in OPEC's ability to provide benefits for all members came under scrutiny recently after member nation Angola left the oil cartel in favor of pursuing uncapped Crude Oil production.

Crude Oil continues to catch support in the near term from Federal Reserve (Fed) rate cut expectations, and an overly dovish/hawkish showing from the Fed’s latest meeting minutes due later on Thursday could further bolster barrel bids, or send Crude Oil back down again as investors readjust expectations following the Fed’s latest meeting update.

WTI Technical Outlook

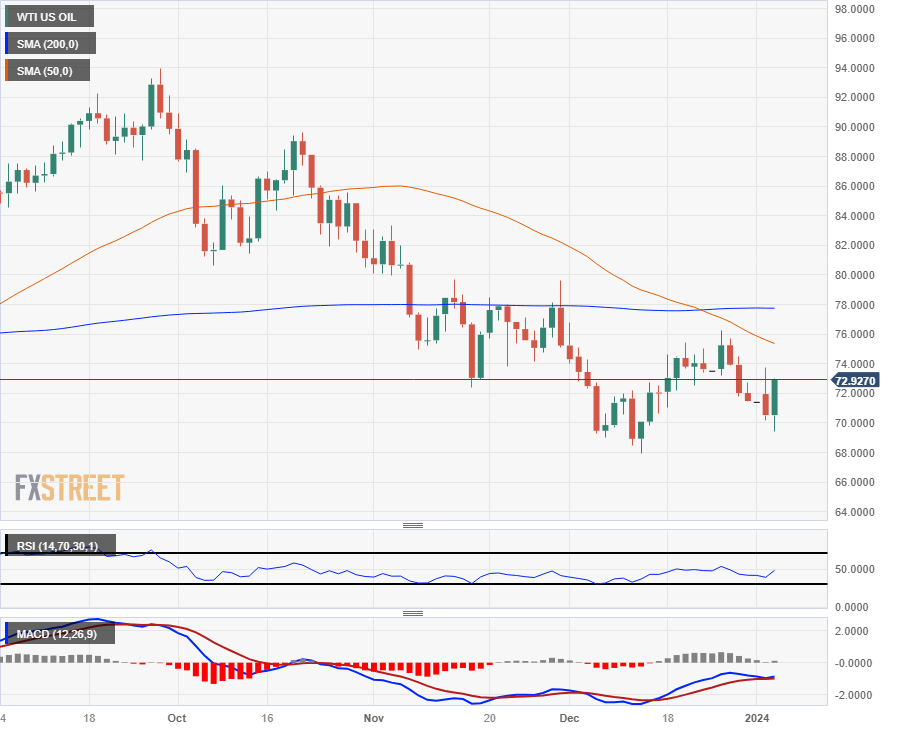
Wednesday’s rebound in WTI further highlights just how far Crude Oil has fallen; WTI remains down an eye-watering 22% from September’s peak of $93.98. Daily candlesticks remain below the 200-day Simple Moving Average (SMA) at $78.00, and a bearish cross of the 50-day SMA has baked in a technical ceiling near $76.00.

Intraday action remains capped below the 200-hour SMA near $73.50, and a bullish break to the topside will see additional technical resistance from last week’s peak near the $76.00 handle.

WTI Hourly Chart
WTI Daily Chart
WTI Technical Levels


Disclaimer: For information purposes only. Past performance is not indicative of future results.
placeholder
Gold Price Forecast: XAU/USD declines below $4,050 on USD strength and hawkish Fed comments Gold price (XAU/USD) extends the decline to around $4,030 during the early Asian session on Tuesday. The precious metal edges lower as traders dialed back expectations of a US interest rate cut next month.
Author  FXStreet
Nov 18, Tue
Gold price (XAU/USD) extends the decline to around $4,030 during the early Asian session on Tuesday. The precious metal edges lower as traders dialed back expectations of a US interest rate cut next month.
placeholder
Bitcoin Volatility Spikes: Is Options-Driven Pricing Making a Comeback?Bitcoin's volatility is surging, suggesting a shift back to options-driven price action seen before Bitcoin ETFs were launched.
Author  Mitrade
Nov 24, Mon
Bitcoin's volatility is surging, suggesting a shift back to options-driven price action seen before Bitcoin ETFs were launched.
placeholder
2025 Black Friday is coming! Which stocks may see volatility?Coming on the day right after Thanksgiving in the United States, Back Friday marks the start of the holiday shopping season. Sales data from this shopping frenzy day reflects investor confidence and consumer trends. The National Retail Federation (NRF) predicts that holiday season (Nov and Dec) retail sales in 2025 will likely exceed $1 trillion for the very first time, which represents a year-over-year increase of 3.7 to 4.2 percent. Historic data from the past decade show that the retail sector has generally outperformed the S&P 500 during the weeks before and after Black Friday. The following retailing companies are expected to be big winners:
Author  Insights
Nov 24, Mon
Coming on the day right after Thanksgiving in the United States, Back Friday marks the start of the holiday shopping season. Sales data from this shopping frenzy day reflects investor confidence and consumer trends. The National Retail Federation (NRF) predicts that holiday season (Nov and Dec) retail sales in 2025 will likely exceed $1 trillion for the very first time, which represents a year-over-year increase of 3.7 to 4.2 percent. Historic data from the past decade show that the retail sector has generally outperformed the S&P 500 during the weeks before and after Black Friday. The following retailing companies are expected to be big winners:
placeholder
Bitcoin Bleeds to $86K, But This Key Indicator Screams "The Top Isn't In"Bitcoin’s adjusted Spent Output Profit Ratio (aSOPR) has spent nearly two years coiling below the extremes seen at past bull-market peaks, even as BTC trades around $86,300 and down 9% on the week — a setup that leaves open the possibility that this cycle’s true top may still lie ahead.
Author  Mitrade
Nov 25, Tue
Bitcoin’s adjusted Spent Output Profit Ratio (aSOPR) has spent nearly two years coiling below the extremes seen at past bull-market peaks, even as BTC trades around $86,300 and down 9% on the week — a setup that leaves open the possibility that this cycle’s true top may still lie ahead.
placeholder
Bitcoin Price Rebound Gains Traction with $90K Break in SightBitcoin is trading above $87,000 and its 100-hour SMA after rebounding from $83,500, with a bearish trend line at $88,200 and resistance at $89,000–$90,000 now in focus as BTC either breaks higher toward $91,750–$94,000 or slips back toward $86,700, $85,000 and lower supports.
Author  Mitrade
Yesterday 02: 58
Bitcoin is trading above $87,000 and its 100-hour SMA after rebounding from $83,500, with a bearish trend line at $88,200 and resistance at $89,000–$90,000 now in focus as BTC either breaks higher toward $91,750–$94,000 or slips back toward $86,700, $85,000 and lower supports.
goTop
quote