Silver Price Forecast: XAG/USD pulls back from all-time highs, hovers around $27.00

Source Fxstreet
  • Silver price could find a key support area around the major level of $27.50, following the psychological level of $26.00.
  • Technical analysis suggests confirmation of the bullish sentiment.
  • The immediate resistance zone appears around the all-time high of $27.33 and the major support at $27.50.

Silver price attempts to snap its five-day winning streak, retreating from the all-time highs and trading near $27.00 per troy ounce during early European hours on Thursday. The price of the Silver received upward support as the US Dollar lost ground due to the dovish sentiment surrounding the Federal Reserve’s (Fed) interest rates trajectory.

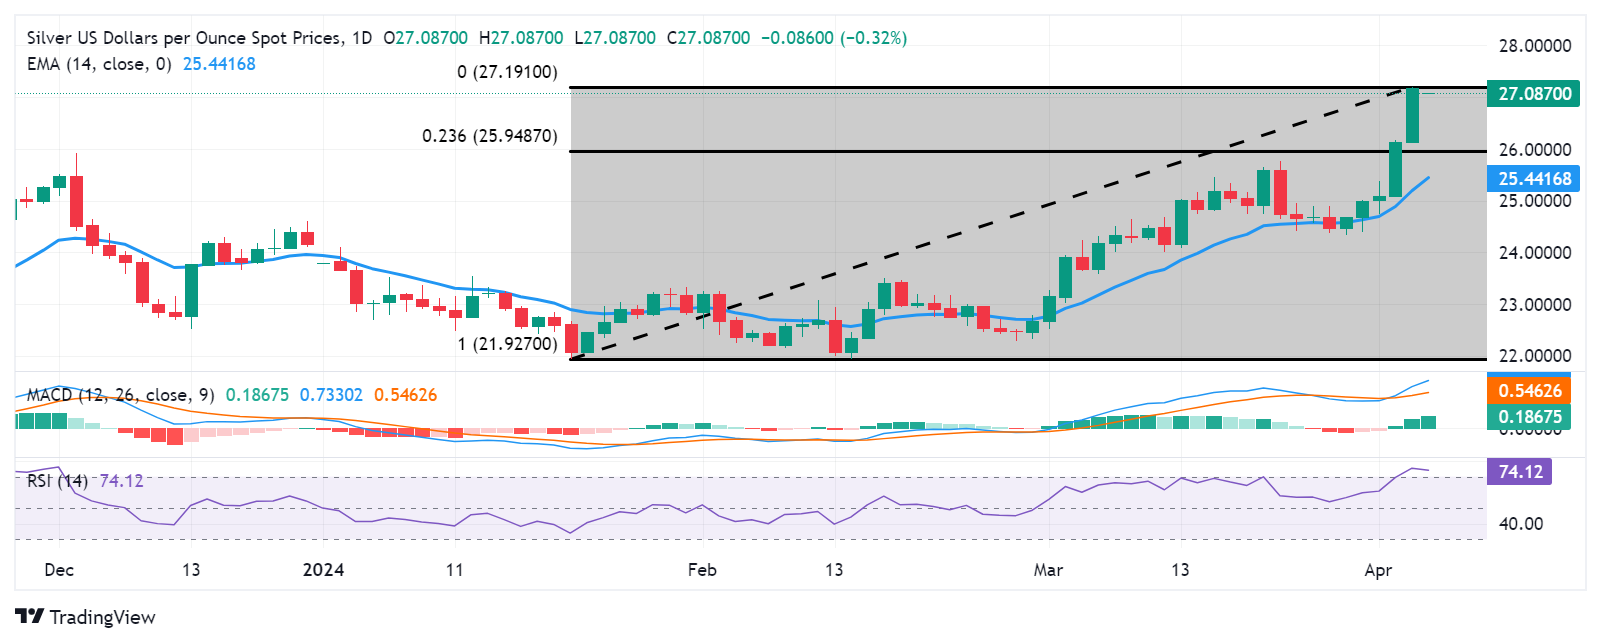
Silver price could find key support around the major level of $27.50, following the psychological level of $26.00, in conjunction with the 23.6% Fibonacci retracement level of $25.94. A break below this level could exert downward pressure on navigating the region around a major support level of $25.50 and the 14-exponential Moving Average (EMA) of $25.43.

Technical analysis suggests a bullish confirmation for the Gold price. The 14-day Relative Strength Index (RSI) is positioned above the 50 mark, indicating strength in buying momentum. Additionally, the Moving Average Convergence Divergence (MACD) shows a divergence above the signal line and remains above the centerline.

On the upside, the all-time high of $27.33 could act as an immediate resistance, followed by the major support at $27.50. A breakthrough above the latter could lead the Silver price to explore the region around the psychological level of $28.00.

XAG/USD: Daily Chart

XAG/USD

Overview
Today last price 27.06
Today Daily Change -0.11
Today Daily Change % -0.40
Today daily open 27.17
 
Trends
Daily SMA20 24.93
Daily SMA50 23.66
Daily SMA100 23.66
Daily SMA200 23.42
 
Levels
Previous Daily High 27.19
Previous Daily Low 26.12
Previous Weekly High 25
Previous Weekly Low 24.33
Previous Monthly High 25.77
Previous Monthly Low 22.51
Daily Fibonacci 38.2% 26.78
Daily Fibonacci 61.8% 26.53
Daily Pivot Point S1 26.47
Daily Pivot Point S2 25.76
Daily Pivot Point S3 25.4
Daily Pivot Point R1 27.54
Daily Pivot Point R2 27.9
Daily Pivot Point R3 28.61


Disclaimer: For information purposes only. Past performance is not indicative of future results.
placeholder
Bulls Rout. Bitcoin Slumps Over 16% in a Week to Hit Bottom, Cryptocurrency Market Faces "Serial Liquidations"During the Asian trading session on June 5, Bitcoin extended its recent slump, falling more than 3.5% within 24 hours. It briefly broke below $62,000, hitting a low of $61,100, bringing i
Author  TradingKey
Jun 05, Fri
During the Asian trading session on June 5, Bitcoin extended its recent slump, falling more than 3.5% within 24 hours. It briefly broke below $62,000, hitting a low of $61,100, bringing i
placeholder
Gold declines below $4,500 on stalled US-Iran ceasefire talks, US NFP data loomsGold price (XAU/USD) edges lower to near $4,470 during the early Asian session on Friday. The precious metal remains volatile amid ongoing geopolitical turmoil. Traders will closely monitor the developments surrounding the US-Iran peace deal and the US May employment report later on Friday. 
Author  FXStreet
Jun 05, Fri
Gold price (XAU/USD) edges lower to near $4,470 during the early Asian session on Friday. The precious metal remains volatile amid ongoing geopolitical turmoil. Traders will closely monitor the developments surrounding the US-Iran peace deal and the US May employment report later on Friday. 
placeholder
Bitcoin Suffers Year’s Strongest Waterfall-Style Decline. Will It Next Drop to the $60,000 Mark?During the Asian trading session on June 4, Bitcoin continued its multi-day slump, briefly dropping below the $62,000 mark to $61,338. As of press time, Bitcoin was trading at $63,844, wi
Author  TradingKey
Jun 04, Thu
During the Asian trading session on June 4, Bitcoin continued its multi-day slump, briefly dropping below the $62,000 mark to $61,338. As of press time, Bitcoin was trading at $63,844, wi
placeholder
Bitcoin drops below $65K amid reinforced bear market signalsBitcoin (BTC) dipped further below $65,000 on Wednesday, with onchain data from Glassnode signaling a market firmly in a bear phase. The decline has pushed prices back into a key valuation range between the Realized Price and the True Market Mean.
Author  FXStreet
Jun 04, Thu
Bitcoin (BTC) dipped further below $65,000 on Wednesday, with onchain data from Glassnode signaling a market firmly in a bear phase. The decline has pushed prices back into a key valuation range between the Realized Price and the True Market Mean.
placeholder
Forex Today: US Dollar stays resilient ahead of key US dataHere is what you need to know on Wednesday, June 3:
Author  FXStreet
Jun 03, Wed
Here is what you need to know on Wednesday, June 3:
Related Instrument
goTop
quote