Silver Price Analysis: XAG/USD jumps back closer to YTD top, seems poised to climb further

Source Fxstreet
  • Silver scales higher for the fourth straight day and spikes to a one-and-half-week high.
  • The technical setup favours bullish traders and supports prospects for additional gains.
  • Any meaningful corrective decline is likely to find decent support near the $25.00 mark.

Silver (XAG/USD) gains positive traction for the fourth straight day on Tuesday and climbs further beyond mid-$25.00s during the first half of the European session, back closer to the YTD peak touched last week.

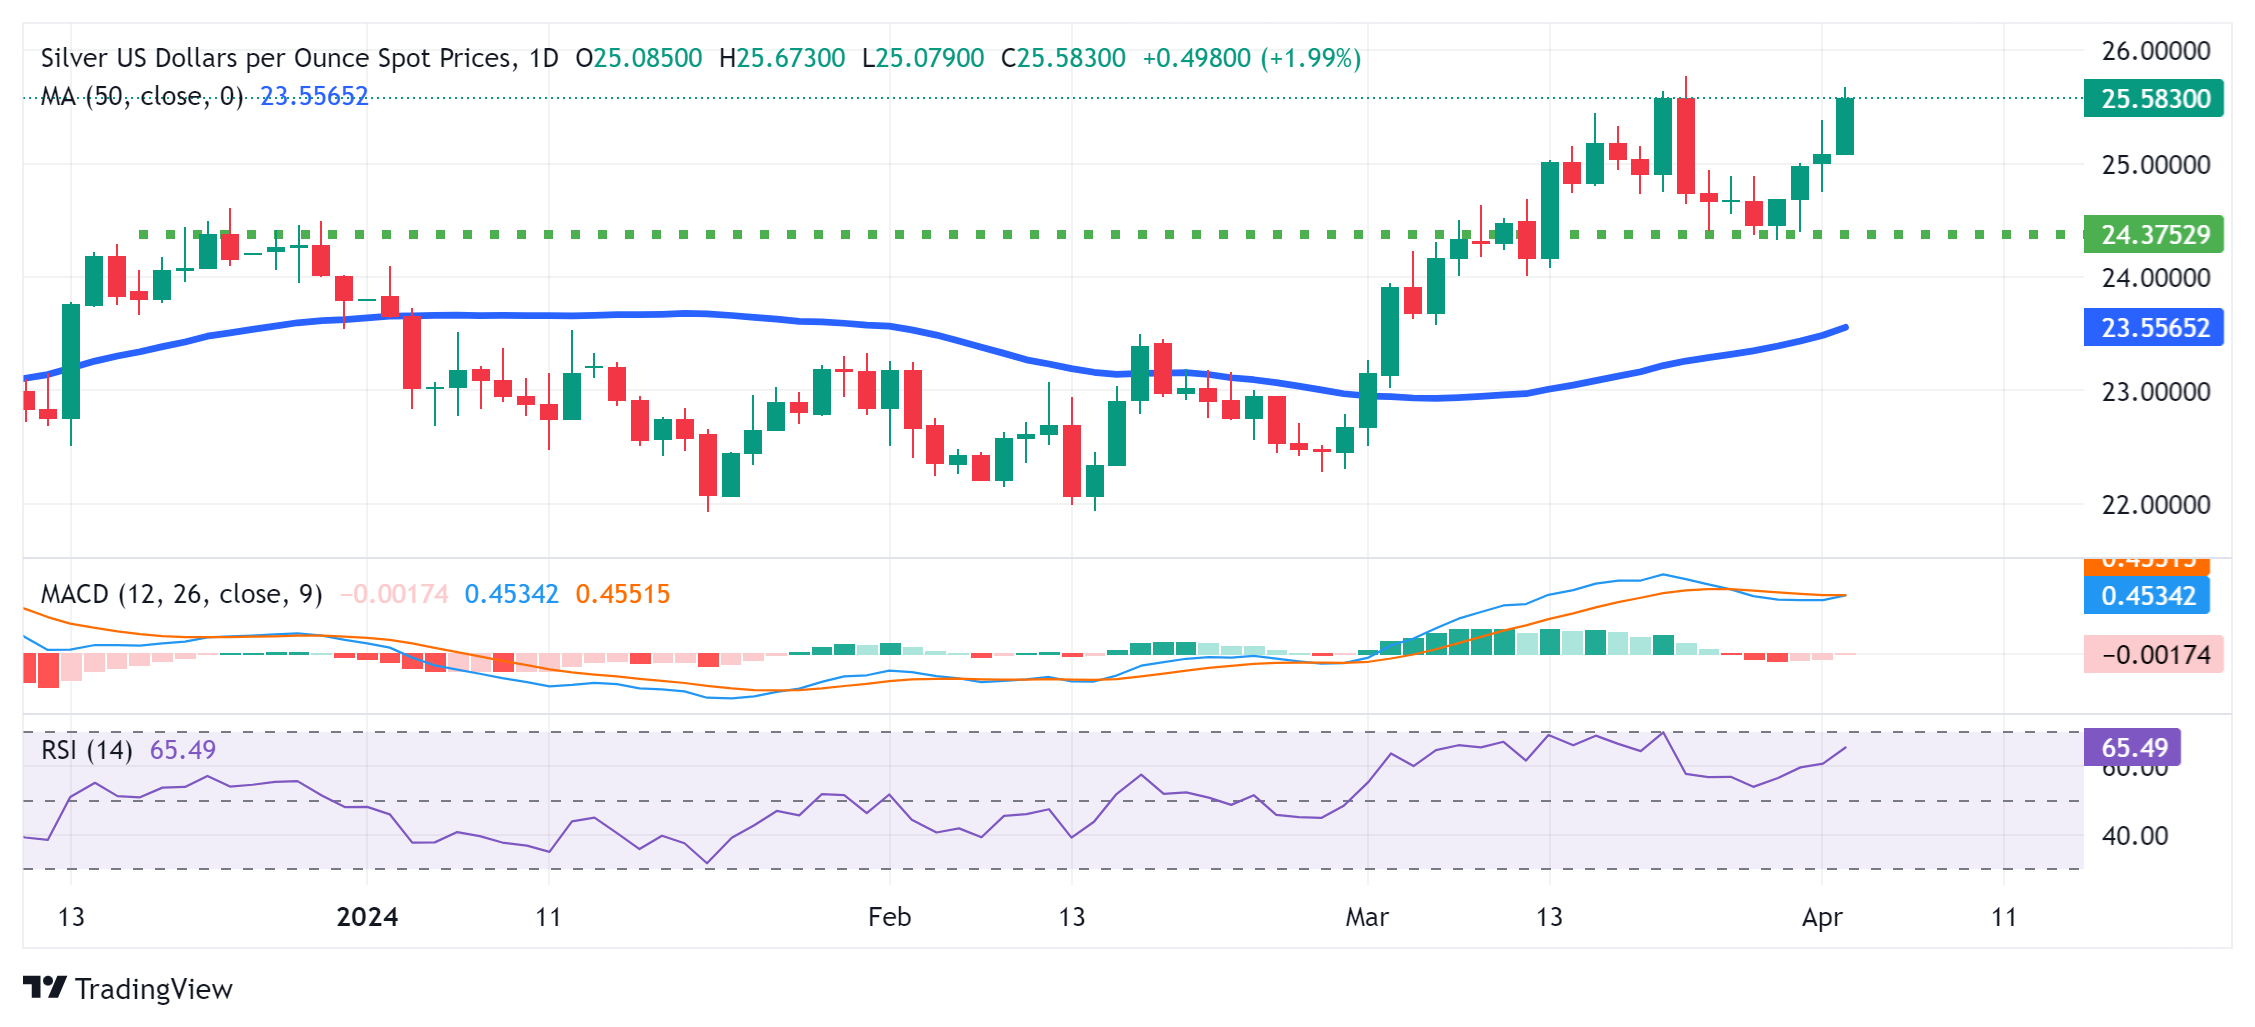
From a technical perspective, the recent bounce from the $24.35 resistance-turned-support zone and a subsequent strong move up favours bullish traders. Moreover, oscillators on the daily chart are holding in the positive territory and are still far from being in the overbought zone, suggesting that the path of least resistance for the XAG/USD is to the upside.

Hence, some follow-through strength towards testing the December 2023 swing high, just ahead of the $26.00 round figure, looks like a distinct possibility. Some follow-through buying would mark a fresh breakout and allow the XAG/USD to resume its recent strong upward trajectory witnessed since late February.

On the flip side, any meaningful corrective decline is more likely to attract fresh buyers near the $25.00 psychological mark. The next relevant support is pegged near the $24.65 region. A convincing break below the latter could drag the XAG/USD towards the aforementioned resistance-turned-support, around the $24.35 zone, which should act as a key pivotal point.

Some follow-through selling might shift the bias in favour of bearish traders and make the XAG/USD vulnerable to accelerate the decline further towards the $24.15-$24.10 region. The white metal could eventually weaken below the $24.00 round-figure mark, towards the 50-day Simple Moving Average (SMA), currently pegged near the $23.60 zone.

Silver daily chart
fxsoriginal

XAG/USD

Overview
Today last price 25.62
Today Daily Change 0.54
Today Daily Change % 2.15
Today daily open 25.08
 
Trends
Daily SMA20 24.64
Daily SMA50 23.49
Daily SMA100 23.58
Daily SMA200 23.39
 
Levels
Previous Daily High 25.38
Previous Daily Low 24.75
Previous Weekly High 25
Previous Weekly Low 24.33
Previous Monthly High 25.77
Previous Monthly Low 22.51
Daily Fibonacci 38.2% 25.14
Daily Fibonacci 61.8% 24.99
Daily Pivot Point S1 24.76
Daily Pivot Point S2 24.43
Daily Pivot Point S3 24.12
Daily Pivot Point R1 25.4
Daily Pivot Point R2 25.71
Daily Pivot Point R3 26.04


Disclaimer: For information purposes only. Past performance is not indicative of future results.
placeholder
Bitcoin slides deeper into red as bears lean on $96,600 wall and eye $90,000Bitcoin extends its decline after failing to reclaim $96,500, trading below $95,000, the 100-hour SMA and a bearish trend line near $96,600; unless bulls can force a decisive close back above $96,600–$97,200, the short-term path of least resistance stays lower, with $92,500, $90,000 and the main $88,500 support zone in focus.
Author  Mitrade
Nov 17, Mon
Bitcoin extends its decline after failing to reclaim $96,500, trading below $95,000, the 100-hour SMA and a bearish trend line near $96,600; unless bulls can force a decisive close back above $96,600–$97,200, the short-term path of least resistance stays lower, with $92,500, $90,000 and the main $88,500 support zone in focus.
placeholder
Gold Price Forecast: XAU/USD declines below $4,050 on USD strength and hawkish Fed comments Gold price (XAU/USD) extends the decline to around $4,030 during the early Asian session on Tuesday. The precious metal edges lower as traders dialed back expectations of a US interest rate cut next month.
Author  FXStreet
Yesterday 01: 23
Gold price (XAU/USD) extends the decline to around $4,030 during the early Asian session on Tuesday. The precious metal edges lower as traders dialed back expectations of a US interest rate cut next month.
placeholder
Ethereum Edges Toward Long-Term Holders’ Cost Basis, Now Only 8% Above Key Accumulation LevelEthereum is trading near $3,150 and just 8% above a key $2,895 long-term holders’ cost basis, with on-chain flows, macro uncertainty and support around $3,000–$2,800 all shaping what comes next for ETH.
Author  Mitrade
Yesterday 02: 28
Ethereum is trading near $3,150 and just 8% above a key $2,895 long-term holders’ cost basis, with on-chain flows, macro uncertainty and support around $3,000–$2,800 all shaping what comes next for ETH.
placeholder
Ethereum Dips Below $3,000: Is the Bull Market at an End?Ethereum's price plunged below $3,000 for the first time in four months, marking growing concerns of a potential end to the bull market.
Author  Mitrade
Yesterday 03: 34
Ethereum's price plunged below $3,000 for the first time in four months, marking growing concerns of a potential end to the bull market.
placeholder
Top 3 Price Prediction: Bitcoin, Ethereum, Ripple – BTC, ETH and XRP Look for a Foothold After a Sharp ShakeoutBitcoin trades near $92,600 after a dip below $90,000, while Ethereum around $3,118 and XRP near $2.21–$2.23 sit on key support zones, as BTC, ETH and XRP all try to turn a sharp correction into a tradable rebound rather than a deeper slide.
Author  Mitrade
8 hours ago
Bitcoin trades near $92,600 after a dip below $90,000, while Ethereum around $3,118 and XRP near $2.21–$2.23 sit on key support zones, as BTC, ETH and XRP all try to turn a sharp correction into a tradable rebound rather than a deeper slide.
goTop
quote