

AUD/USD stays steady as traders digest RBA decision, eyes on Fed meeting

Source Fxstreet
  • AUD/USD steady post-RBA's dovish stance and static rates.
  • US housing data boosts optimism pre-FOMC decision.
  • Fed policy update awaited, with eyes on interest rate forecasts.

The Australian Dollar begins Wednesday’s Asian session virtually unchanged against the US Dollar,  following Tuesday’s loss of 0.41%, after the Reserve Bank of Australia (RBA) decision. The RBA kept rates unchanged, tilting more dovish than expected. That said, the AUD/USD trades at 0.6532, almost flat.

Aussie Dollar stays firm following the central bank decision

On Tuesday, the Bank of Japan (BoJ) and the RBA announced their March monetary policy decisions. The BoJ hiked rates by ten basis points, the first in 17 years, ending the era of negative interest rates. In addition, it ended the Yield Curve Control (YCC) and its ETF buying program. The RBA softened its tone while keeping the door open for additional tightening if needed.

In the meantime, US equities ended the session in the green as the Federal Open Market Committee (FOMC) decisions loom. Data-wise, the US economic docket revealed housing data. Building Permits increased by 1.9% from 1.489 M to 1.518M, improving sharply compared to January’s data. Housing Starts rose 10.7% from 1.425M to 1.521 M.

An absent economic docket in Australia keeps AUD/USD traders waiting for the Fed’s decision. ANZ analysts commented that they expect the Fed to make no major changes to the Summary of Economic Projections (SEP). Regarding rate cuts, they noted, “We think it will cut in 25bp increments through the second half of the year, reducing the nominal Fed funds corridor by 100bp this year.”

AUD/USD Price Analysis: Technical outlook

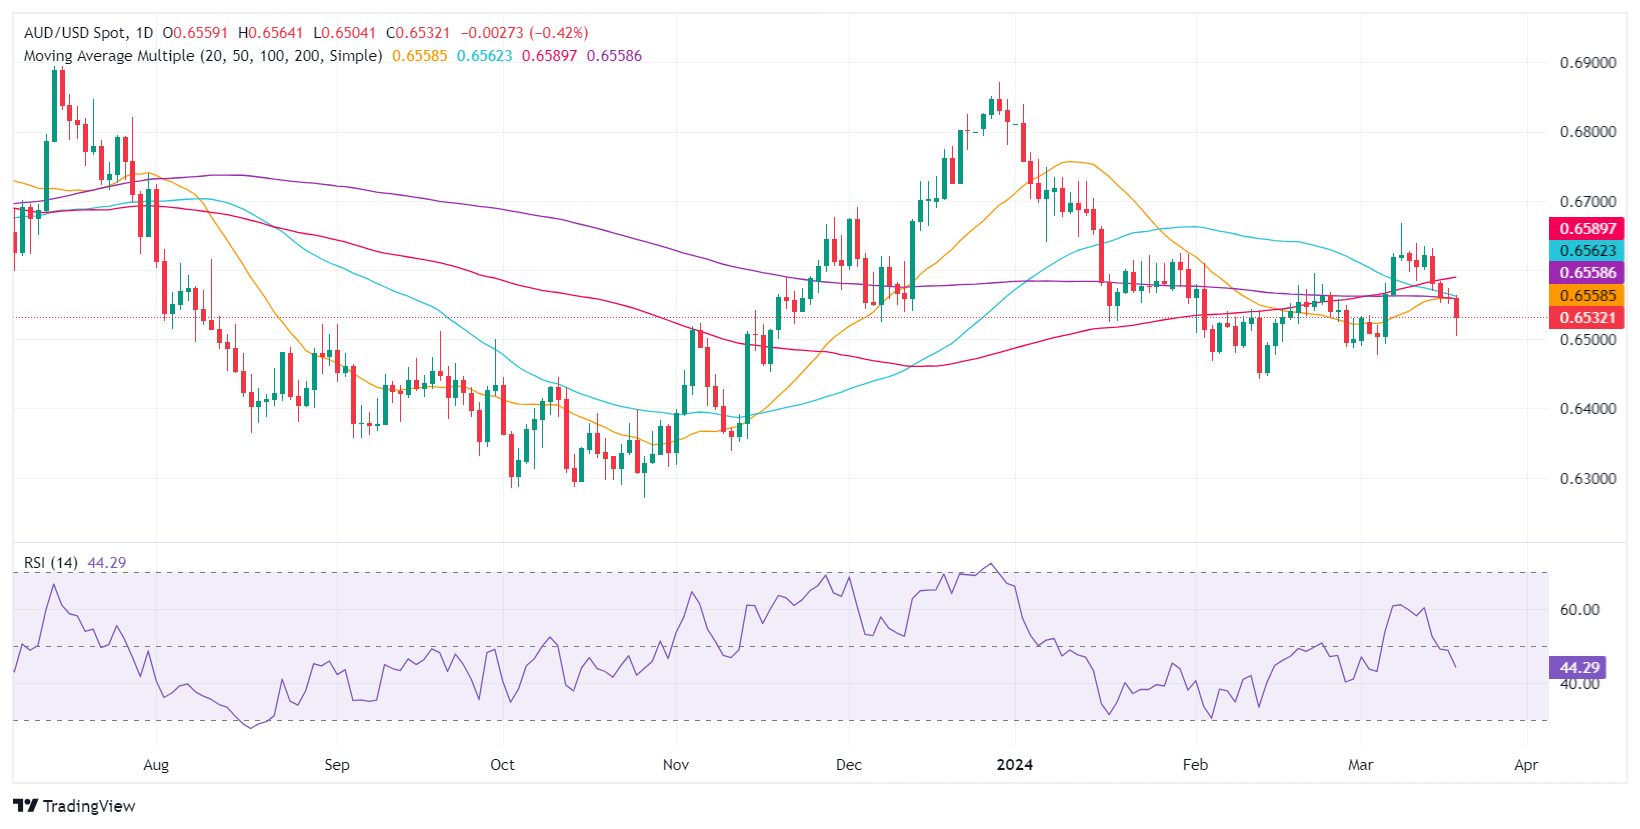
 The AUD/USD fell below the 200-day moving average (DMA) of 0.6556, opening the door for further losses. This comes after the RBA decision, and with speculations for a Fed “hawkish” tilt, that would exacerbate a dip to 0.6500. Further losses are seen below March 5 swing low of 0.6477, and the February 13 low of 0.6442. On the upside, the 200-DMA would be the first resistance, followed by the 50-DMA at 0.6558 and the 100-DMA at 0.6586.
AUD/USD

Overview
Today last price 0.653
Today Daily Change -0.0029
Today Daily Change % -0.44
Today daily open 0.6559
 
Trends
Daily SMA20 0.656
Daily SMA50 0.6565
Daily SMA100 0.6588
Daily SMA200 0.656
 
Levels
Previous Daily High 0.6574
Previous Daily Low 0.6551
Previous Weekly High 0.6639
Previous Weekly Low 0.6552
Previous Monthly High 0.661
Previous Monthly Low 0.6443
Daily Fibonacci 38.2% 0.656
Daily Fibonacci 61.8% 0.6565
Daily Pivot Point S1 0.6549
Daily Pivot Point S2 0.6538
Daily Pivot Point S3 0.6526
Daily Pivot Point R1 0.6572
Daily Pivot Point R2 0.6585
Daily Pivot Point R3 0.6595


Disclaimer: For information purposes only. Past performance is not indicative of future results.
placeholder
Gold Price Forecast: PPI and Oil Prices Fuel Inflation Concerns, Can CPI Change Gold's Direction?As of the Asian session on September 11, gold prices (XAUUSD) remained in weak consolidation today after dropping sharply to near $4,300 on Thursday, with the latest price trading around
Author  TradingKey
Sep 11, Fri
As of the Asian session on September 11, gold prices (XAUUSD) remained in weak consolidation today after dropping sharply to near $4,300 on Thursday, with the latest price trading around
placeholder
US August CPI lands tonight: after a 5.4% PPI shock, will the Fed hike on September 16?US August PPI came in at 5.4% year-on-year, above the 5.3% consensus, with core PPI at 4.6%. Traders have pushed the odds of a 25bp Fed hike on September 15-16 to around 70%. Tonight's CPI is the last major inflation print before the decision — here is the full calendar, the consensus numbers, and what a hot versus cool reading would mean for the dollar, yields, gold and stocks.
Author  Irene Q.
Sep 11, Fri
US August PPI came in at 5.4% year-on-year, above the 5.3% consensus, with core PPI at 4.6%. Traders have pushed the odds of a 25bp Fed hike on September 15-16 to around 70%. Tonight's CPI is the last major inflation print before the decision — here is the full calendar, the consensus numbers, and what a hot versus cool reading would mean for the dollar, yields, gold and stocks.
placeholder
US-Iran Conflict Drives Oil Surge as WTI Tops $100 and Brent Nears $110International oil prices continued to advance rapidly this week. On Thursday Eastern Time, WTI crude (USOIL) broke through the $100/barrel mark, closing at $103.94, up 7.51%; Brent crude
Author  TradingKey
Sep 11, Fri
International oil prices continued to advance rapidly this week. On Thursday Eastern Time, WTI crude (USOIL) broke through the $100/barrel mark, closing at $103.94, up 7.51%; Brent crude
placeholder
TradingKey Daily Market Briefing: WTI Oil Tops $100, US Stocks Fall for 4th Day, Apple Bucks Trend, CPI AheadTracking Market TrendsTradingKey - On September 10 Eastern Time, the three major US stock indices fell for the fourth consecutive trading day. US August PPI showed upstream price pressures continued t
Author  TradingKey
Sep 11, Fri
Tracking Market TrendsTradingKey - On September 10 Eastern Time, the three major US stock indices fell for the fourth consecutive trading day. US August PPI showed upstream price pressures continued t
placeholder
US August CPI Preview: Will Inflation Reaccelerate? US Stocks, Dollar and Gold Face Key Test On Friday, September 11 (ET), the U.S. Bureau of Labor Statistics will release the Consumer Price Index (CPI) for August, the final major inflation report before the Federal Reserve's Sep
Author  TradingKey
Sep 10, Thu
On Friday, September 11 (ET), the U.S. Bureau of Labor Statistics will release the Consumer Price Index (CPI) for August, the final major inflation report before the Federal Reserve's Sep
Related Instrument
goTop
quote