


GBP/JPY struggles to extend gains after YTD high, holds steady above 197.00
- GBP/JPY consolidates near 197.70 after confirming an ascending triangle breakout last week.
- UK Q1 GDP grew 0.7% QoQ, but falling disposable income and widening current account deficit weigh on sentiment.
- Japan’s Industrial Output rose just 0.5% MoM in May, missing expectations and highlighting weak manufacturing momentum.
The British Pound (GBP) weakens against the Japanese Yen (JPY) on Monday, slipping below the 198.00 handle amid a mild corrective pullback from the year-to-date high of 198.81 marked on Friday. The Pound is losing ground against major peers to start the week.
The GBP/JPY cross is trading flat during the American session, hovering near 197.70 at the time of writing, recovering from an intraday low of 197.21 touched earlier in the day. The cross is consolidating after last week’s sharp rally as investors reassess the UK macro landscape and global risk sentiment.
On the data front, the UK economy expanded by 0.7% in Q1 — the strongest in a year — while annual growth held at 1.3%. However, real household income fell 1.0%, the steepest drop since early 2023, and the saving ratio declined to 10.9%, reflecting pressure on consumer finances. Adding to the weak tone, the Current Account deficit widened to £23.46 billion, sharply above expectations.
In Japan, industrial production rose by 0.5% MoM in May, rebounding from a 1.1% contraction in April but falling well short of the expected 3.4% increase, according to flash estimates. On a yearly basis, output declined by 1.8%, marking the first annual drop in five months and reversing a 0.5% gain seen in April — a sign that Japan’s manufacturing recovery remains fragile.
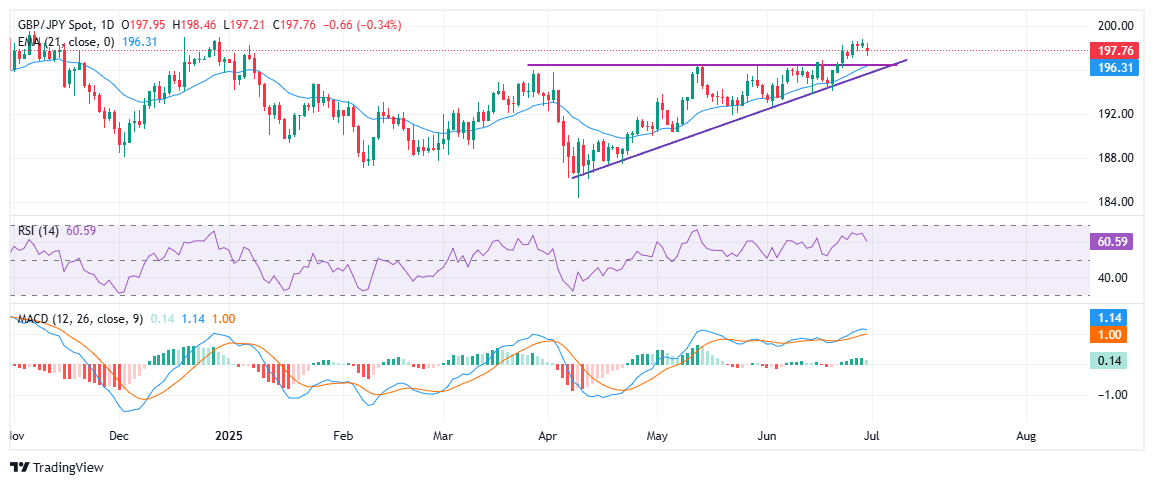
From a technical perspective, GBP/JPY has confirmed a breakout above an ascending triangle pattern, with the upper boundary around 196.00 – 196.50. While the pair is consolidating after hitting a year-to-date high of 198.81 on Friday, the structure remains bullish as long as it holds above the rising trendline and the 21-day Exponential Moving Average (EMA) at 196.31. The Relative Strength Index (RSI) has pulled back to 60, suggesting a pause in momentum, while the MACD remains in bullish territory, though momentum is softening.
A sustained move above 199.00 could trigger a breakout toward the psychological 200.00 level, while a break below 196.30 would invalidate the bullish setup and expose downside risks toward 194.00.
Recommended Articles


