EUR/CHF Price Analysis: Pullback possible amid mixed signals

Source Fxstreet
  • EUR/CHF touches 50-week SMA and recoils
  • RSI on daily chart indicates possibility of a pullback. 
  • Symmetrical Triangle has formed on 4-hour chart with breakout likely. 

EUR/CHF has rebounded from the 0.9254 December 2023 lows and rallied up to resistance from a key barrier in the form of the 50-week Simple Moving Average (SMA). The pair is probably still in a long-term downtrend despite recent strength. 
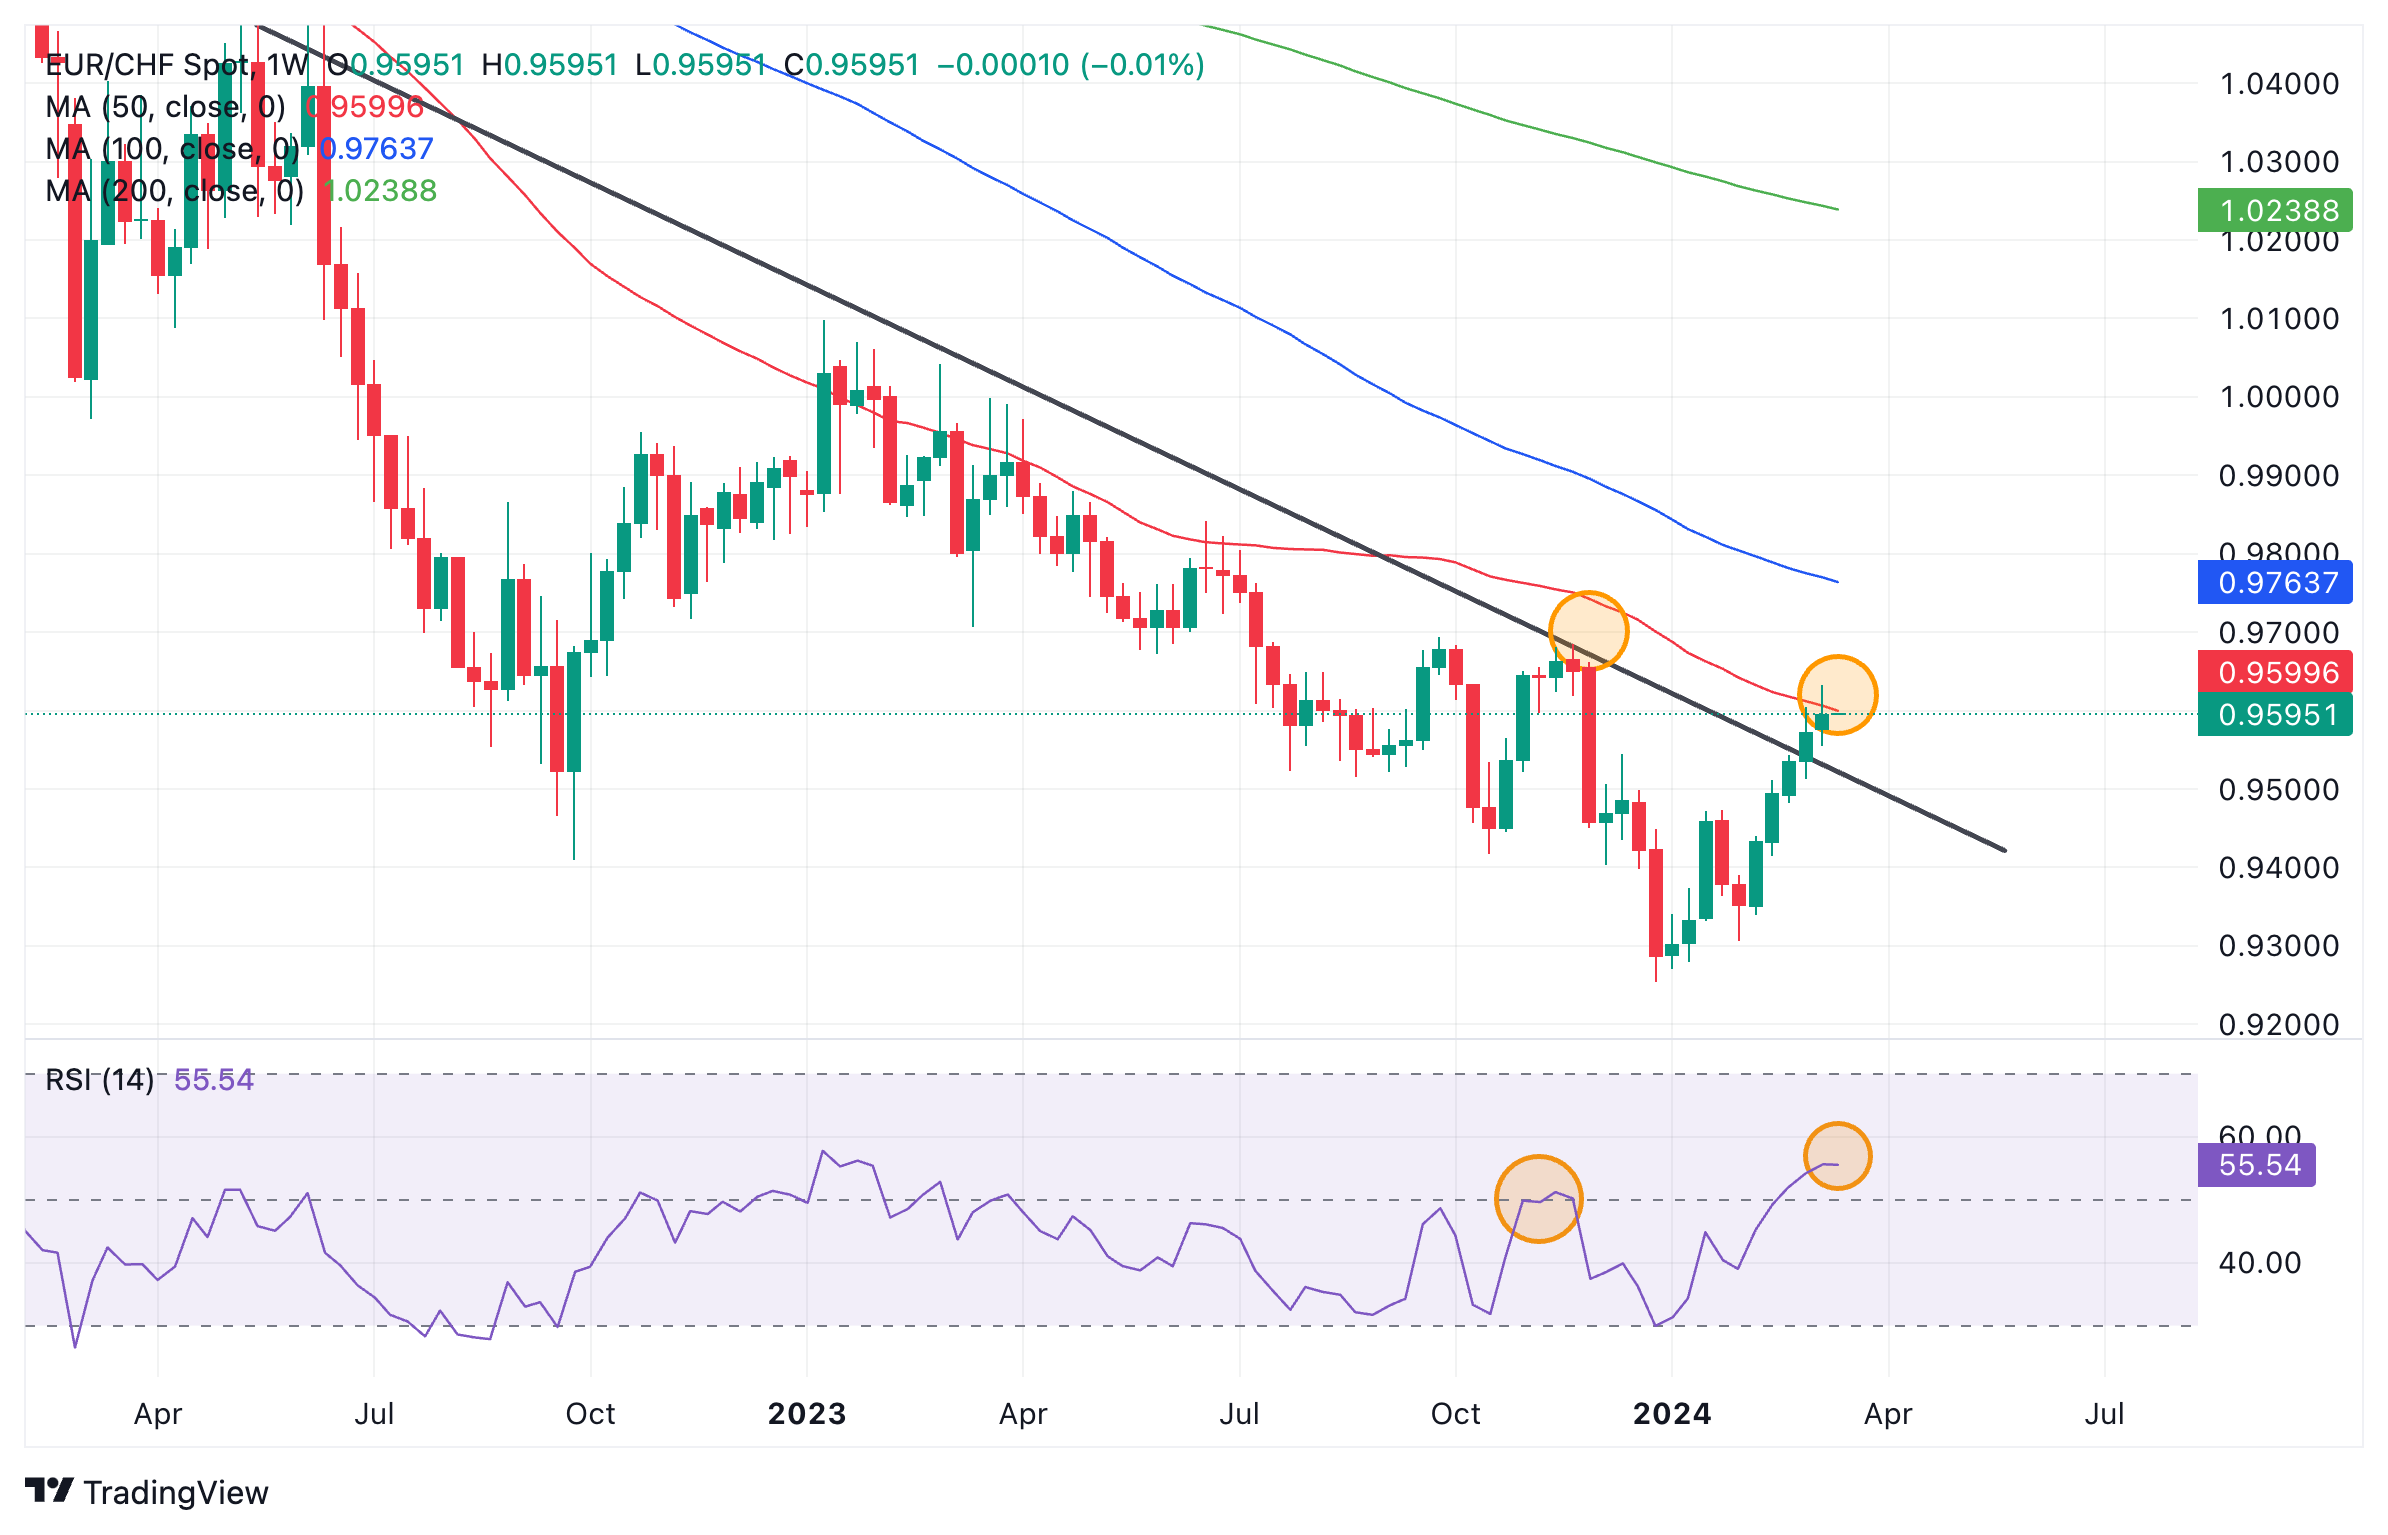
Euro to Swiss Franc: Weekly chart

The price has respected the red 50-week SMA on the multiple prior occasions it touched it during its downtrend. This reinforces the level’s strength as a resistance point. It probably indicates the price is about to pullback. There is a good chance it could correct back to the level of the trendline at around 0.9500 for a retest.  

The pair is converging with the Relative Strength Indicator (RSI), a momentum study. This is a bullish sign. The most recent peak in price was accompanied by a relatively higher peak in RSI when compared to the previous peak in price (circled). This is convergence and suggests underlying strength. 

A further bullish sign is that the pair has broken above the trendline. 
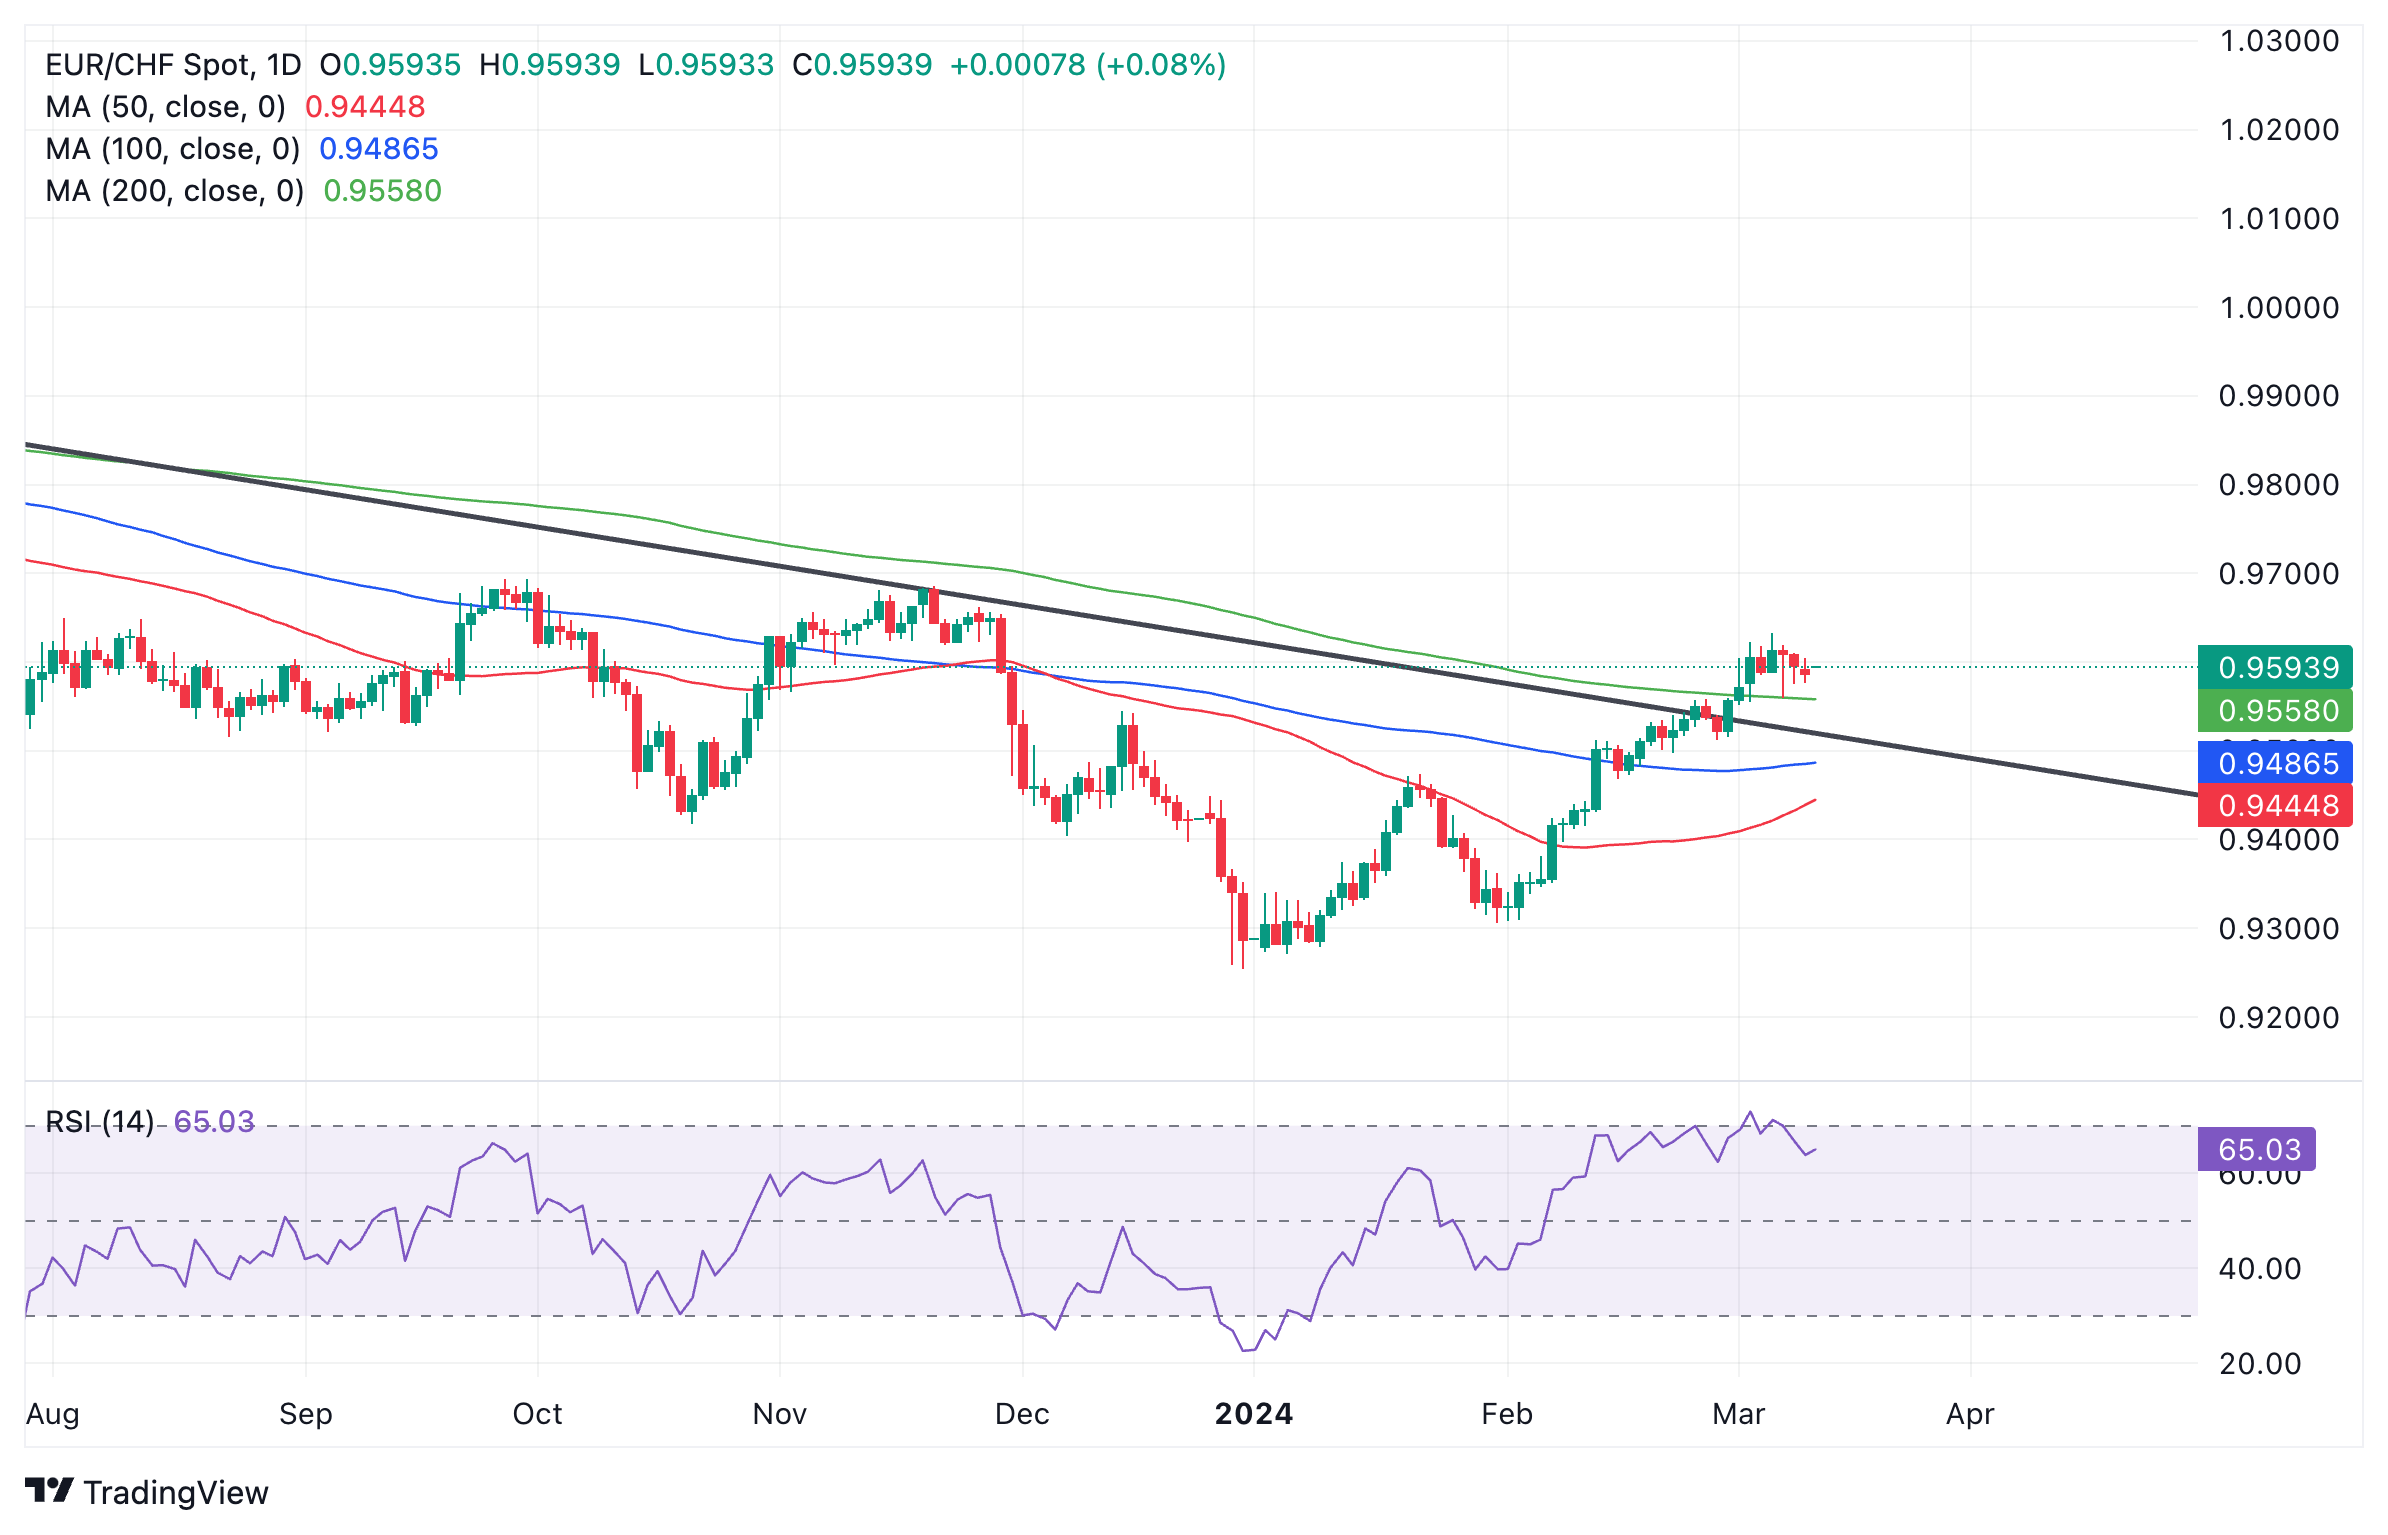
Euro to Swiss Franc: Daily chart

EUR/CHF has just exited overbought extremes on the RSI on the daily chart. This is interpreted as a signal to sell long positions and open short positions. It suggests the pair could pullback down, at least to the level of the trendline at about 0.9500. 

The pair has broken above all the key Moving Averages and the 200-day SMA is acting support. EUR/CHF has also moved above the previous higher low of the downtrend. These are both signs indicating that it is probably in a bullish intermediate trend, favoring bulls on that time horizon. 
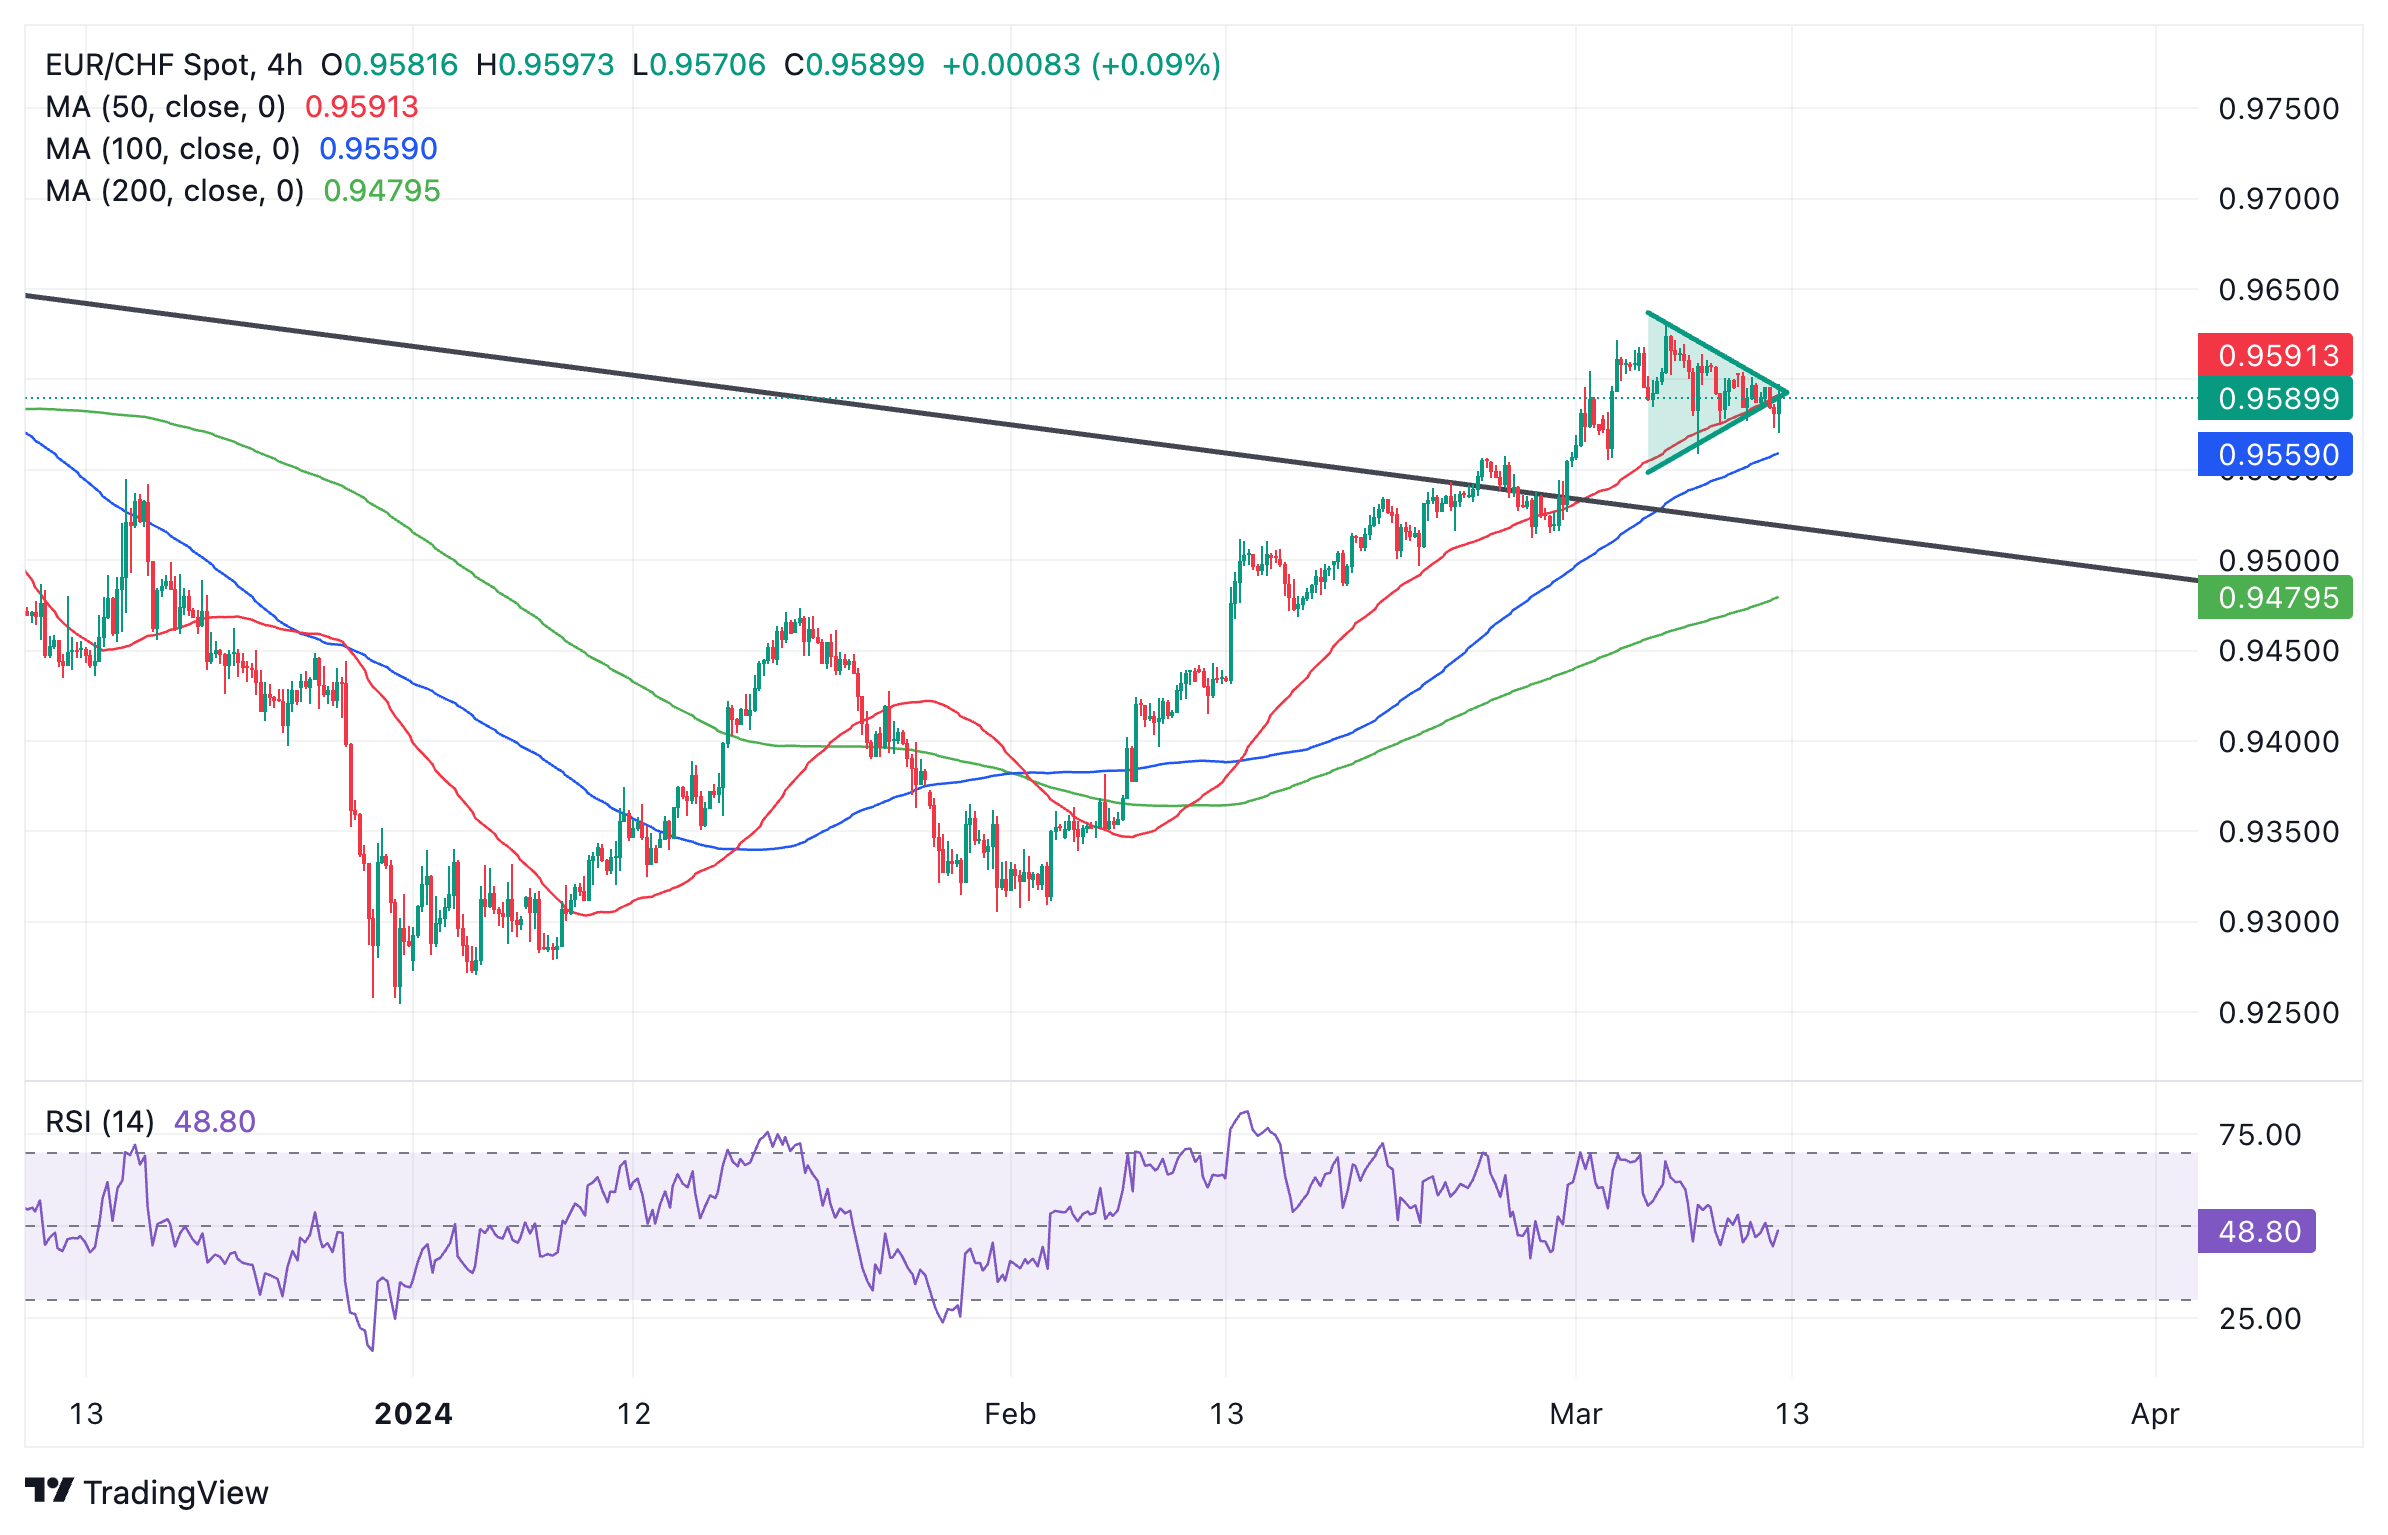
Euro to Swiss Franc: 4-hour chart

EUR/CHF has formed a Symmetrical Triangle on the 4-hour chart suggesting indecision. The pattern has equal chances of it breaking out in either direction, however, some analysts hold that the odds slightly favor a breakout in the direction of the trend prior to the formation of the triangle, which in this case is bullish. 

Should price breakout higher it will probably not rise very much higher before capitulating since triangles are usually the penultimate moves in trends.

The RSI has declined visibly during the formation of the triangle, however, suggesting underlying weakness and a chance price could break lower. 

The 4-hour chart is used to assess the short-term trend. The series of rising peaks and troughs since the December 2023 lows indicates the pair is in a short-term uptrend.


Disclaimer: For information purposes only. Past performance is not indicative of future results.
placeholder
Top 3 Price Prediction: Bitcoin, Ethereum, Ripple – BTC, ETH and XRP Look for a Foothold After a Sharp ShakeoutBitcoin trades near $92,600 after a dip below $90,000, while Ethereum around $3,118 and XRP near $2.21–$2.23 sit on key support zones, as BTC, ETH and XRP all try to turn a sharp correction into a tradable rebound rather than a deeper slide.
Author  Mitrade
Nov 19, Wed
Bitcoin trades near $92,600 after a dip below $90,000, while Ethereum around $3,118 and XRP near $2.21–$2.23 sit on key support zones, as BTC, ETH and XRP all try to turn a sharp correction into a tradable rebound rather than a deeper slide.
placeholder
Market Meltdown: BTC, ETH, and XRP Capitulate as Bears Seize ControlBitcoin trades around $85,900 after breaking below $86,000, with Ethereum under $2,791 and XRP below $1.99 as BTC, ETH and XRP extend weekly losses of 8–10%, forcing traders to focus on supports at $85,000, $2,749 and $1.77 for clues on whether this sell-off has further to run.
Author  Mitrade
Nov 21, Fri
Bitcoin trades around $85,900 after breaking below $86,000, with Ethereum under $2,791 and XRP below $1.99 as BTC, ETH and XRP extend weekly losses of 8–10%, forcing traders to focus on supports at $85,000, $2,749 and $1.77 for clues on whether this sell-off has further to run.
placeholder
Bitcoin Volatility Spikes: Is Options-Driven Pricing Making a Comeback?Bitcoin's volatility is surging, suggesting a shift back to options-driven price action seen before Bitcoin ETFs were launched.
Author  Mitrade
11 hours ago
Bitcoin's volatility is surging, suggesting a shift back to options-driven price action seen before Bitcoin ETFs were launched.
placeholder
2025 Black Friday is coming! Which stocks may see volatility?Coming on the day right after Thanksgiving in the United States, Back Friday marks the start of the holiday shopping season. Sales data from this shopping frenzy day reflects investor confidence and consumer trends. The National Retail Federation (NRF) predicts that holiday season (Nov and Dec) retail sales in 2025 will likely exceed $1 trillion for the very first time, which represents a year-over-year increase of 3.7 to 4.2 percent. Historic data from the past decade show that the retail sector has generally outperformed the S&P 500 during the weeks before and after Black Friday. The following retailing companies are expected to be big winners:
Author  Insights
9 hours ago
Coming on the day right after Thanksgiving in the United States, Back Friday marks the start of the holiday shopping season. Sales data from this shopping frenzy day reflects investor confidence and consumer trends. The National Retail Federation (NRF) predicts that holiday season (Nov and Dec) retail sales in 2025 will likely exceed $1 trillion for the very first time, which represents a year-over-year increase of 3.7 to 4.2 percent. Historic data from the past decade show that the retail sector has generally outperformed the S&P 500 during the weeks before and after Black Friday. The following retailing companies are expected to be big winners:
placeholder
Top 3 Price Prediction: Bitcoin, Ethereum, Ripple – BTC, ETH and XRP Attempt Recovery Post-SelloffBitcoin trades back above $87,700 after a 20% drop, while Ethereum rebounds from support around $2,749 and XRP recovers above $2.08 off its $1.96 floor, as BTC, ETH and XRP all try to turn last week’s steep correction into the start of a broader recovery.
Author  Mitrade
9 hours ago
Bitcoin trades back above $87,700 after a 20% drop, while Ethereum rebounds from support around $2,749 and XRP recovers above $2.08 off its $1.96 floor, as BTC, ETH and XRP all try to turn last week’s steep correction into the start of a broader recovery.
goTop
quote