

EUR/USD rebounds into range after US ISM PMI miss sparks risk-on Friday
- EUR/USD vaults back into 1.0840 following market pivot.
- Market risk sentiment sees a late-week recovery on Friday.
- US Manufacturing PMI unexpectedly declines, sparking rate cut hopes.
EUR/USD caught a bounce from 1.0800 after markets pivoted into a risk-on stance following Friday’s US ISM Manufacturing Purchasing Managers Index (PMI) declined, flubbing forecasts and stepping deeper into contraction territory. Slipping economic figures are sparking renewed hopes of Federal Reserve (Fed) rate cuts.
Meanwhile, the Fed’s latest Monetary Policy Report shows the central bank is firming up faith in inflation reaching the 2% target. The European Harmonized Index of Consumer Prices (HICP) inflation fell less than expected in February, helping to provide some sentiment support for the Euro (EUR) on Friday.
Daily digest market movers: EUR/USD attempts to re-enter upper bound of range on US PMI miss
- Pan-European Core HICP inflation came in above expectations for the year ended February, printing at 3.1% YoY versus the forecasted decline to 2.9% from 3.3%.
- Headline YoY HICP inflation slipped to 2.6% versus the forecast 2.5%, previously 2.8% .
- February’s US ISM Manufacturing PMI slips to 47.8 versus forecasted increase to 49.5 from previous 49.1.
- The University of Michigan’s Consumer Sentiment survey index for February also slipped to 76.9, down from the steady forecast of 79.6.
- ISM Manufacturing Prices Paid for February also declined to 52.5, versus the forecast uptick to 53.0 from the previous 52.9.
- Next week sees another US Nonfarm Payrolls (NFP) Friday with the ADP Employment Change preview slated for Wednesday.
- The European Central Bank’s (ECB) latest rate call is also coming next week, slated for Thursday.
Euro price today
The table below shows the percentage change of Euro (EUR) against listed major currencies today. Euro was the strongest against the Japanese Yen.
| USD | EUR | GBP | CAD | AUD | JPY | NZD | CHF | |
| USD | -0.33% | -0.24% | -0.11% | -0.49% | 0.02% | -0.31% | -0.05% | |
| EUR | 0.32% | 0.08% | 0.20% | -0.16% | 0.35% | 0.01% | 0.27% | |
| GBP | 0.24% | -0.08% | 0.11% | -0.25% | 0.27% | -0.07% | 0.19% | |
| CAD | 0.11% | -0.19% | -0.11% | -0.36% | 0.17% | -0.18% | 0.08% | |
| AUD | 0.48% | 0.16% | 0.24% | 0.35% | 0.51% | 0.17% | 0.43% | |
| JPY | -0.03% | -0.35% | -0.27% | -0.15% | -0.51% | -0.34% | -0.07% | |
| NZD | 0.30% | -0.02% | 0.06% | 0.19% | -0.18% | 0.33% | 0.26% | |
| CHF | 0.05% | -0.28% | -0.19% | -0.08% | -0.44% | 0.08% | -0.26% |
The heat map shows percentage changes of major currencies against each other. The base currency is picked from the left column, while the quote currency is picked from the top row. For example, if you pick the Euro from the left column and move along the horizontal line to the Japanese Yen, the percentage change displayed in the box will represent EUR (base)/JPY (quote).
Technical analysis: EUR/USD remains rangebound, finds bullish pickup on Friday
EUR/USD recovered from familiar near-term lows at the 1.0800 handle, rising into 1.0840, and is set to wrap up the trading week close to where it started. Little directional momentum kept the pair in a sideway range for the entire trading week, marked in between 1.0860 and 1.0800.
EUR/USD remains mired in the 200-day Simple Moving Average (SMA) at 1.0830. The pair remains up around 1.3% from the last swing low into 1.0695 in early February.
EUR/USD hourly chart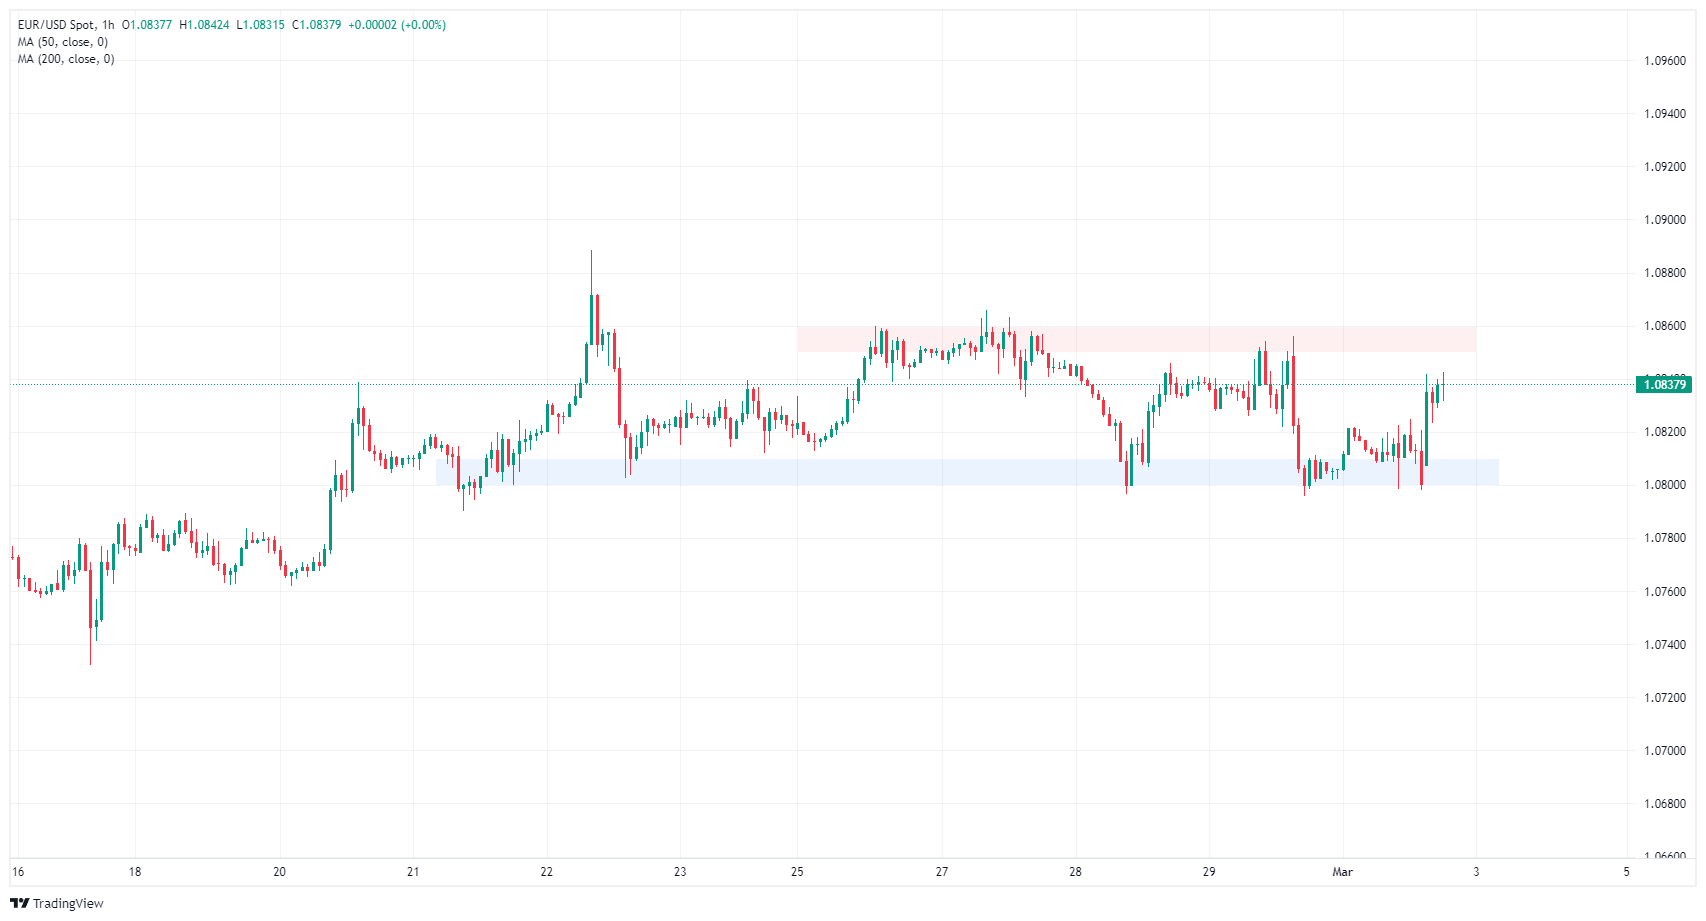
EUR/USD daily chart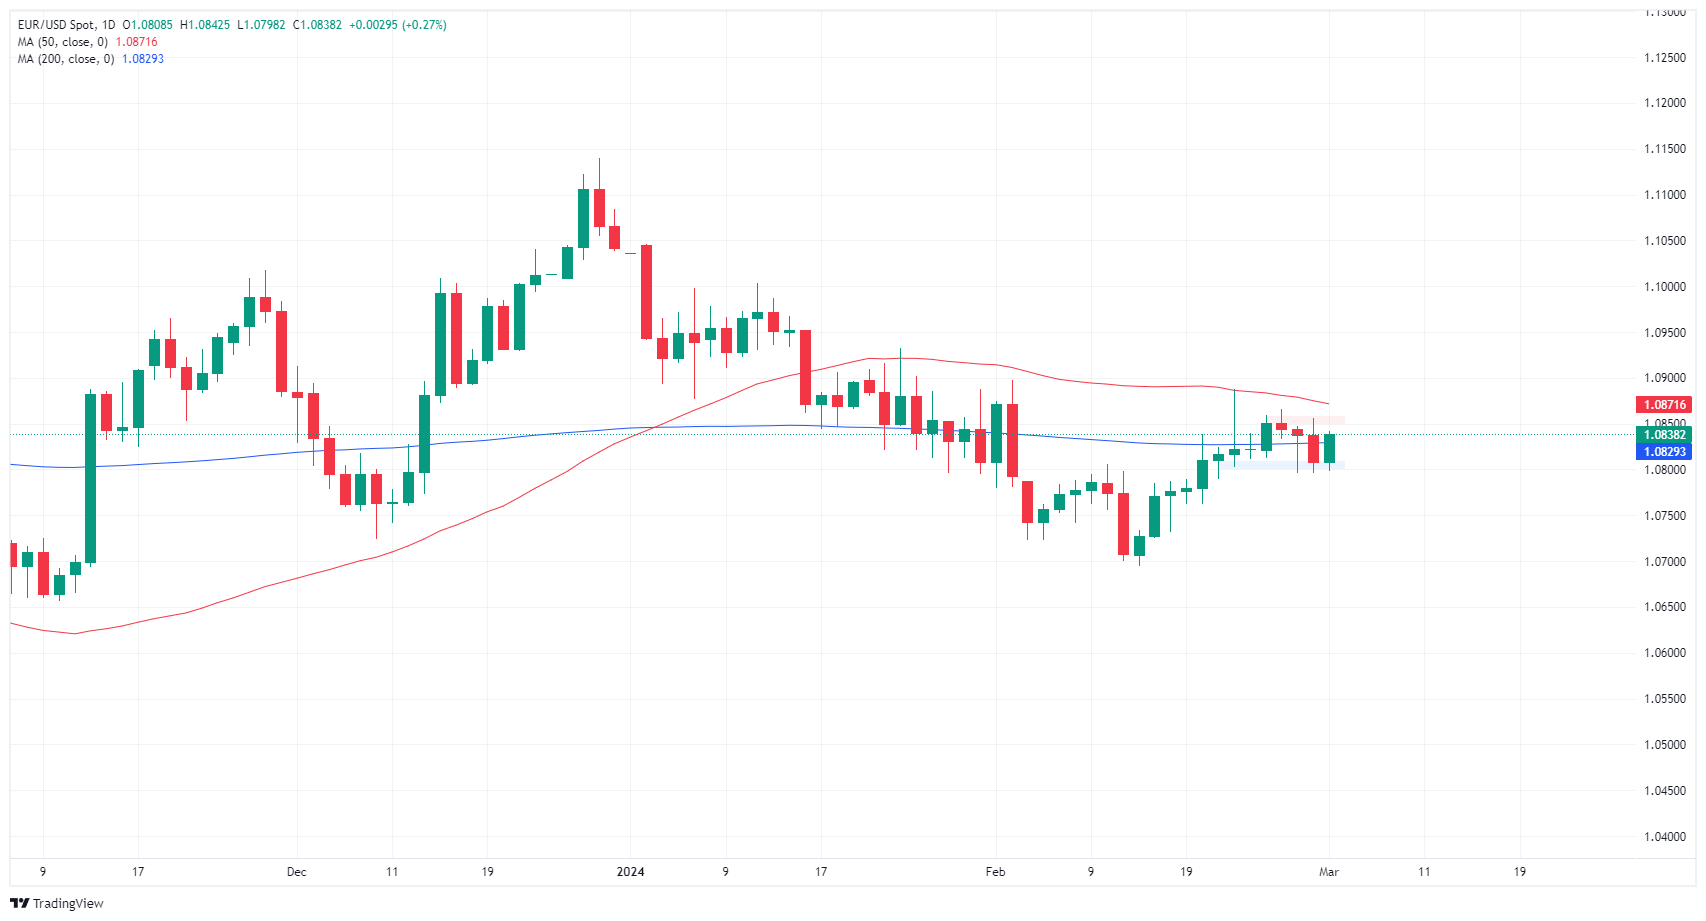
Euro FAQs
What is the Euro?
The Euro is the currency for the 20 European Union countries that belong to the Eurozone. It is the second most heavily traded currency in the world behind the US Dollar. In 2022, it accounted for 31% of all foreign exchange transactions, with an average daily turnover of over $2.2 trillion a day.
EUR/USD is the most heavily traded currency pair in the world, accounting for an estimated 30% off all transactions, followed by EUR/JPY (4%), EUR/GBP (3%) and EUR/AUD (2%).
What is the ECB and how does it impact the Euro?
The European Central Bank (ECB) in Frankfurt, Germany, is the reserve bank for the Eurozone. The ECB sets interest rates and manages monetary policy.
The ECB’s primary mandate is to maintain price stability, which means either controlling inflation or stimulating growth. Its primary tool is the raising or lowering of interest rates. Relatively high interest rates – or the expectation of higher rates – will usually benefit the Euro and vice versa.
The ECB Governing Council makes monetary policy decisions at meetings held eight times a year. Decisions are made by heads of the Eurozone national banks and six permanent members, including the President of the ECB, Christine Lagarde.
How does inflation data impact the value of the Euro?
Eurozone inflation data, measured by the Harmonized Index of Consumer Prices (HICP), is an important econometric for the Euro. If inflation rises more than expected, especially if above the ECB’s 2% target, it obliges the ECB to raise interest rates to bring it back under control.
Relatively high interest rates compared to its counterparts will usually benefit the Euro, as it makes the region more attractive as a place for global investors to park their money.
How does economic data influence the value of the Euro?
Data releases gauge the health of the economy and can impact on the Euro. Indicators such as GDP, Manufacturing and Services PMIs, employment, and consumer sentiment surveys can all influence the direction of the single currency.
A strong economy is good for the Euro. Not only does it attract more foreign investment but it may encourage the ECB to put up interest rates, which will directly strengthen the Euro. Otherwise, if economic data is weak, the Euro is likely to fall.
Economic data for the four largest economies in the euro area (Germany, France, Italy and Spain) are especially significant, as they account for 75% of the Eurozone’s economy.
How does the Trade Balance impact the Euro?
Another significant data release for the Euro is the Trade Balance. This indicator measures the difference between what a country earns from its exports and what it spends on imports over a given period.
If a country produces highly sought after exports then its currency will gain in value purely from the extra demand created from foreign buyers seeking to purchase these goods. Therefore, a positive net Trade Balance strengthens a currency and vice versa for a negative balance.
Recommended Articles


