AUD/JPY Price Analysis: Trades soft near 90.10 zone with bearish outlook intact

Source Fxstreet
  • AUD/JPY trades near the 90.10 area after easing modestly ahead of the Asian session.
  • Momentum indicators are mixed, but moving averages continue to align with bearish pressure.
  • Resistance is seen at 90.49, 90.50, and 90.57, while downside risk builds below the 90.00 handle.

The AUDJPY pair is flashing an overall bearish signal, currently trading around 90.10 after a modest dip during Tuesday’s session. The cross remains mid-range between the day’s low of 89.64 and high of 90.58, suggesting hesitation in either direction as markets await fresh momentum into Asia.

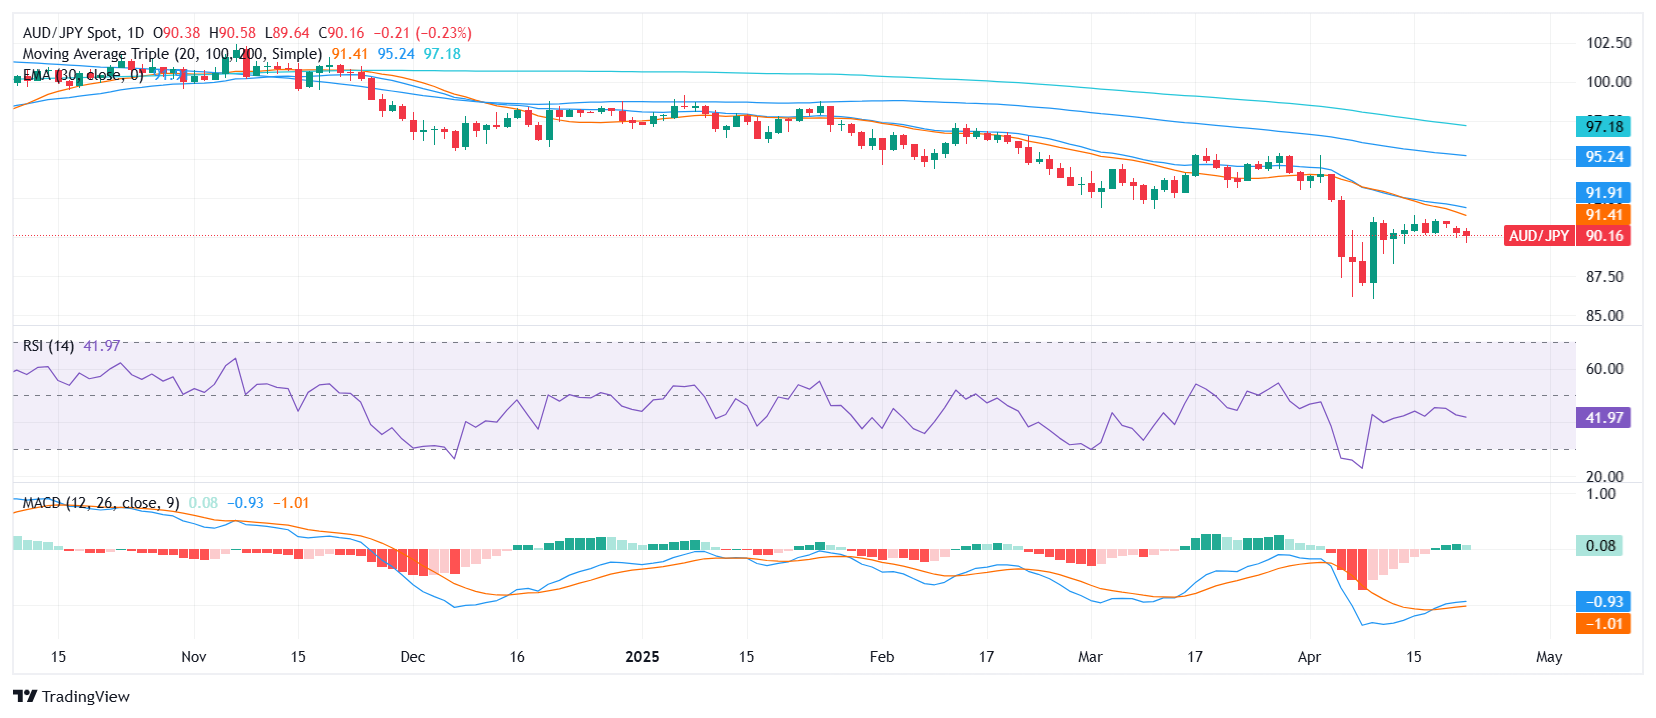
From a technical perspective, short-term indicators show a mixed picture. The Relative Strength Index (RSI) holds neutral near the 42 level, while the MACD is beginning to flash a buy signal. Complementing the indecisiveness, both the Stochastic %K and the Commodity Channel Index (CCI) remain in neutral territory, suggesting consolidation rather than trend continuation in the near term.

Despite the muted momentum, broader trend signals continue to lean bearish. The 20-day, 100-day, and 200-day Simple Moving Averages (SMAs), all located above 91.00, confirm prevailing downside bias. The 10-day EMA and SMA, sitting just above the current price at 90.57 and 90.50 respectively, add immediate resistance.

Traders may look to resistance levels at 90.49, 90.50, and 90.57 should any bullish correction emerge. However, the overall tone remains cautious, with sellers likely to retain control if the pair remains capped below the 91.00 region.


AUD/JPY daily chart


Disclaimer: For information purposes only. Past performance is not indicative of future results.
placeholder
2025 Black Friday is coming! Which stocks may see volatility?Coming on the day right after Thanksgiving in the United States, Back Friday marks the start of the holiday shopping season. Sales data from this shopping frenzy day reflects investor confidence and consumer trends. The National Retail Federation (NRF) predicts that holiday season (Nov and Dec) retail sales in 2025 will likely exceed $1 trillion for the very first time, which represents a year-over-year increase of 3.7 to 4.2 percent. Historic data from the past decade show that the retail sector has generally outperformed the S&P 500 during the weeks before and after Black Friday. The following retailing companies are expected to be big winners:
Author  Insights
Nov 24, Mon
Coming on the day right after Thanksgiving in the United States, Back Friday marks the start of the holiday shopping season. Sales data from this shopping frenzy day reflects investor confidence and consumer trends. The National Retail Federation (NRF) predicts that holiday season (Nov and Dec) retail sales in 2025 will likely exceed $1 trillion for the very first time, which represents a year-over-year increase of 3.7 to 4.2 percent. Historic data from the past decade show that the retail sector has generally outperformed the S&P 500 during the weeks before and after Black Friday. The following retailing companies are expected to be big winners:
placeholder
Bitcoin Bleeds to $86K, But This Key Indicator Screams "The Top Isn't In"Bitcoin’s adjusted Spent Output Profit Ratio (aSOPR) has spent nearly two years coiling below the extremes seen at past bull-market peaks, even as BTC trades around $86,300 and down 9% on the week — a setup that leaves open the possibility that this cycle’s true top may still lie ahead.
Author  Mitrade
Nov 25, Tue
Bitcoin’s adjusted Spent Output Profit Ratio (aSOPR) has spent nearly two years coiling below the extremes seen at past bull-market peaks, even as BTC trades around $86,300 and down 9% on the week — a setup that leaves open the possibility that this cycle’s true top may still lie ahead.
placeholder
Bitcoin Price Rebound Gains Traction with $90K Break in SightBitcoin is trading above $87,000 and its 100-hour SMA after rebounding from $83,500, with a bearish trend line at $88,200 and resistance at $89,000–$90,000 now in focus as BTC either breaks higher toward $91,750–$94,000 or slips back toward $86,700, $85,000 and lower supports.
Author  Mitrade
Yesterday 02: 58
Bitcoin is trading above $87,000 and its 100-hour SMA after rebounding from $83,500, with a bearish trend line at $88,200 and resistance at $89,000–$90,000 now in focus as BTC either breaks higher toward $91,750–$94,000 or slips back toward $86,700, $85,000 and lower supports.
placeholder
Bitcoin Targets $89K Breakout as S&P 500 Nears ATH on Fed Rate Cut HopesBitcoin price action shows signs of a potential short squeeze as it hovers near $88,000, with analysts watching liquidity dynamics that could push it toward $89,000 or retrace to $85,000.
Author  Mitrade
7 hours ago
Bitcoin price action shows signs of a potential short squeeze as it hovers near $88,000, with analysts watching liquidity dynamics that could push it toward $89,000 or retrace to $85,000.
placeholder
Ethereum Reclaims $3K Handle—Is a Breakout Imminent?Ethereum has jumped back above $3,000 and reclaimed key Fib levels, with a bullish trend line at $2,880 and strong MACD/RSI readings putting a breakout above $3,120–$3,165 — and a possible run toward $3,320–$3,350 — on the table, as long as support around $2,980–$2,920 holds.
Author  Mitrade
7 hours ago
Ethereum has jumped back above $3,000 and reclaimed key Fib levels, with a bullish trend line at $2,880 and strong MACD/RSI readings putting a breakout above $3,120–$3,165 — and a possible run toward $3,320–$3,350 — on the table, as long as support around $2,980–$2,920 holds.
goTop
quote