

USD/JPY Price Forecast: At make or a break around 140.00
- USD/JPY pares some of its intraday losses as the US Dollar strives to gain a temporary ground.
- The US Dollar has remained weak due to multiple headwinds.
- The BoJ is expected to continue raising interest rates.
The USD/JPY pair recovers some of its intraday losses but is still trading down near 140.65 during North American trading hours on Tuesday. The asset has demonstrated a sharp downside move in the last two weeks and revisited the 21-month low near 139.60.
The pair has remained weak as back-and-forth tariff announcements by United States (US) President Donald Trump and his tussle with Federal Reserve (Fed) Chair Jerome Powell have dampened the credibility of the US Dollar.
During North American trading hours, the US Dollar Index (DXY), which tracks the Greenback’s value against six major currencies, attracts some bids and rebounds to near 98.50 but is still close to the three-year low of 98.00.
Meanwhile, the Japanese Yen (JPY) has performed strongly as the global economic uncertainty due to an absence of clarity over Trump’s tariffs has improved its safe-haven appeal.
Additionally, firm expectations that the Bank of Japan (BoJ) will hike interest rates again this year have also strengthened the Yen. The BoJ is expected to continue supporting interest rate hikes, a report from Reuters indicated. The agency reported that higher risks from higher US tariffs won’t derail a cycle of rising wages and inflation seen as crucial to keep raising interest rates.
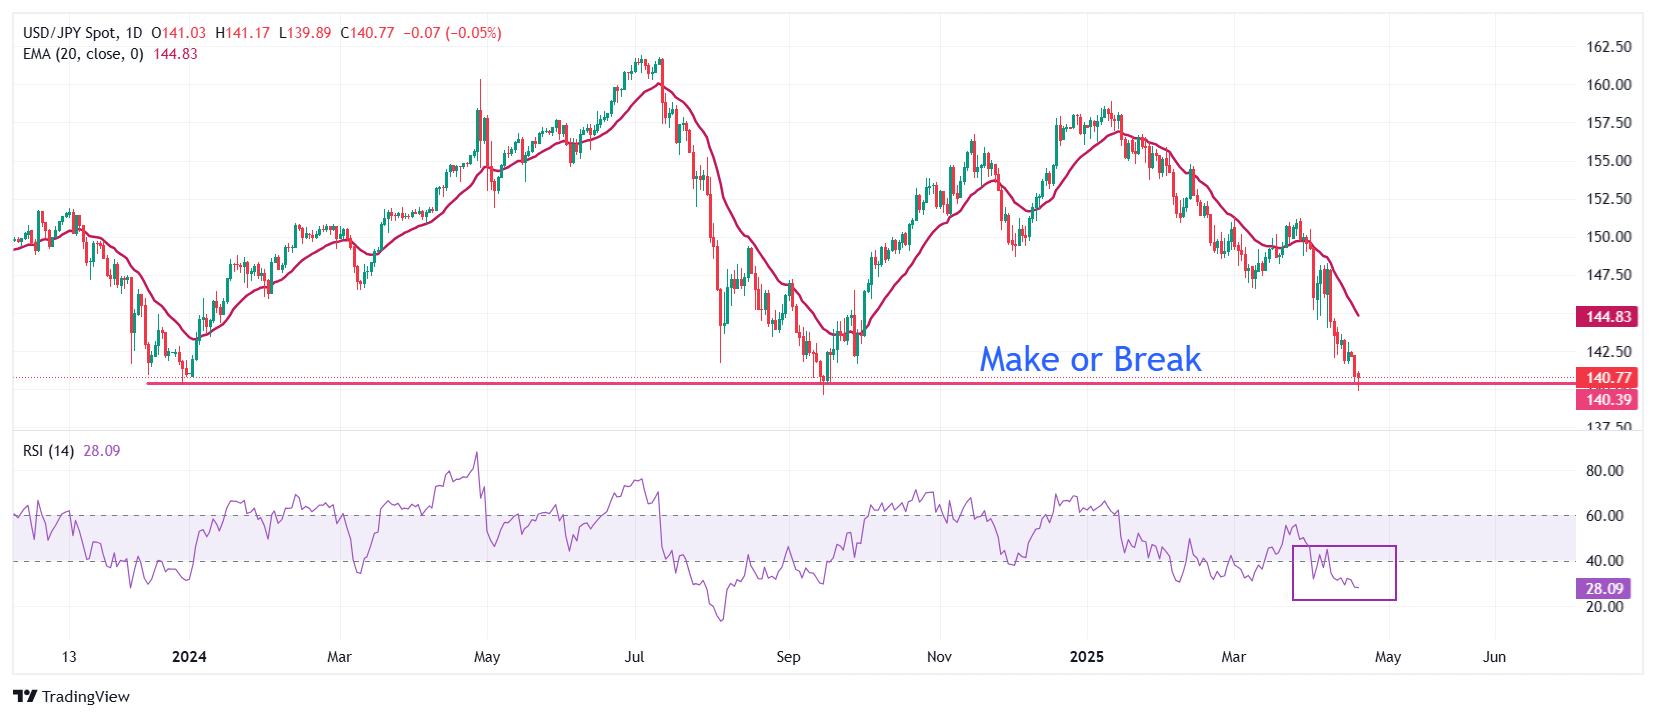
USD/JPY trades at a make-or-break point near the psychological level of 140.00. The outlook of the pair is strongly bearish as the 20-day Exponential Moving Average (EMA) is sloping downwards, which trades around 144.80.
The 14-day Relative Strength Index (RSI) oscillates in the bearish range of 20.00-40.00, indicating a strong downside momentum.
The asset would face more downside towards the 28 July 2023 low of 138.00 and the 14 July 2023 low of 137.25 after sliding below the September 16 low of 139.58.
On the flip side, a recovery move above the April 21 high of 142.15 will drive the asset towards the April 16 high of 143.28, followed by the April 9 low of 144.00.
USD/JPY daily chart
Japanese Yen FAQs
The Japanese Yen (JPY) is one of the world’s most traded currencies. Its value is broadly determined by the performance of the Japanese economy, but more specifically by the Bank of Japan’s policy, the differential between Japanese and US bond yields, or risk sentiment among traders, among other factors.
One of the Bank of Japan’s mandates is currency control, so its moves are key for the Yen. The BoJ has directly intervened in currency markets sometimes, generally to lower the value of the Yen, although it refrains from doing it often due to political concerns of its main trading partners. The BoJ ultra-loose monetary policy between 2013 and 2024 caused the Yen to depreciate against its main currency peers due to an increasing policy divergence between the Bank of Japan and other main central banks. More recently, the gradually unwinding of this ultra-loose policy has given some support to the Yen.
Over the last decade, the BoJ’s stance of sticking to ultra-loose monetary policy has led to a widening policy divergence with other central banks, particularly with the US Federal Reserve. This supported a widening of the differential between the 10-year US and Japanese bonds, which favored the US Dollar against the Japanese Yen. The BoJ decision in 2024 to gradually abandon the ultra-loose policy, coupled with interest-rate cuts in other major central banks, is narrowing this differential.
The Japanese Yen is often seen as a safe-haven investment. This means that in times of market stress, investors are more likely to put their money in the Japanese currency due to its supposed reliability and stability. Turbulent times are likely to strengthen the Yen’s value against other currencies seen as more risky to invest in.
Recommended Articles


