EUR/USD Price Analysis: Edges toward 1.0830 as bullish momentum builds post-Europe

Source Fxstreet
  • EUR/USD was seen trading near the 1.0830 zone on Friday after the European session, moving closer to the top of its daily range.
  • Despite mixed oscillator signals, short- and long-term moving averages support the pair’s ongoing bullish momentum.
  • Support is seen around 1.0790–1.0810, while resistance stands near 1.0845; MACD flashes a sell, but trend bias remains bullish.

EUR/USD extended its upward trajectory on Friday, moving near the 1.0830 region after the European session and toward the upper end of the day’s trading range. The pair has gained traction, reflecting investor appetite for the euro despite mixed short-term signals. Technicals reveal an ongoing bullish backdrop, underpinned by supportive moving averages, though caution remains as oscillators flash neutral-to-negative cues.

Momentum indicators are mixed. The short-term Relative Strength Index is neutral at 5.91, and when combined with the Stochastic indicator, it confirms a lack of clear directional drive. The Moving Average Convergence Divergence (MACD) flashes a sell signal, while the longer-term RSI (14) sits at around 57. The Bull Bear Power also remains marginally negative, suggesting slight hesitation despite recent gains.

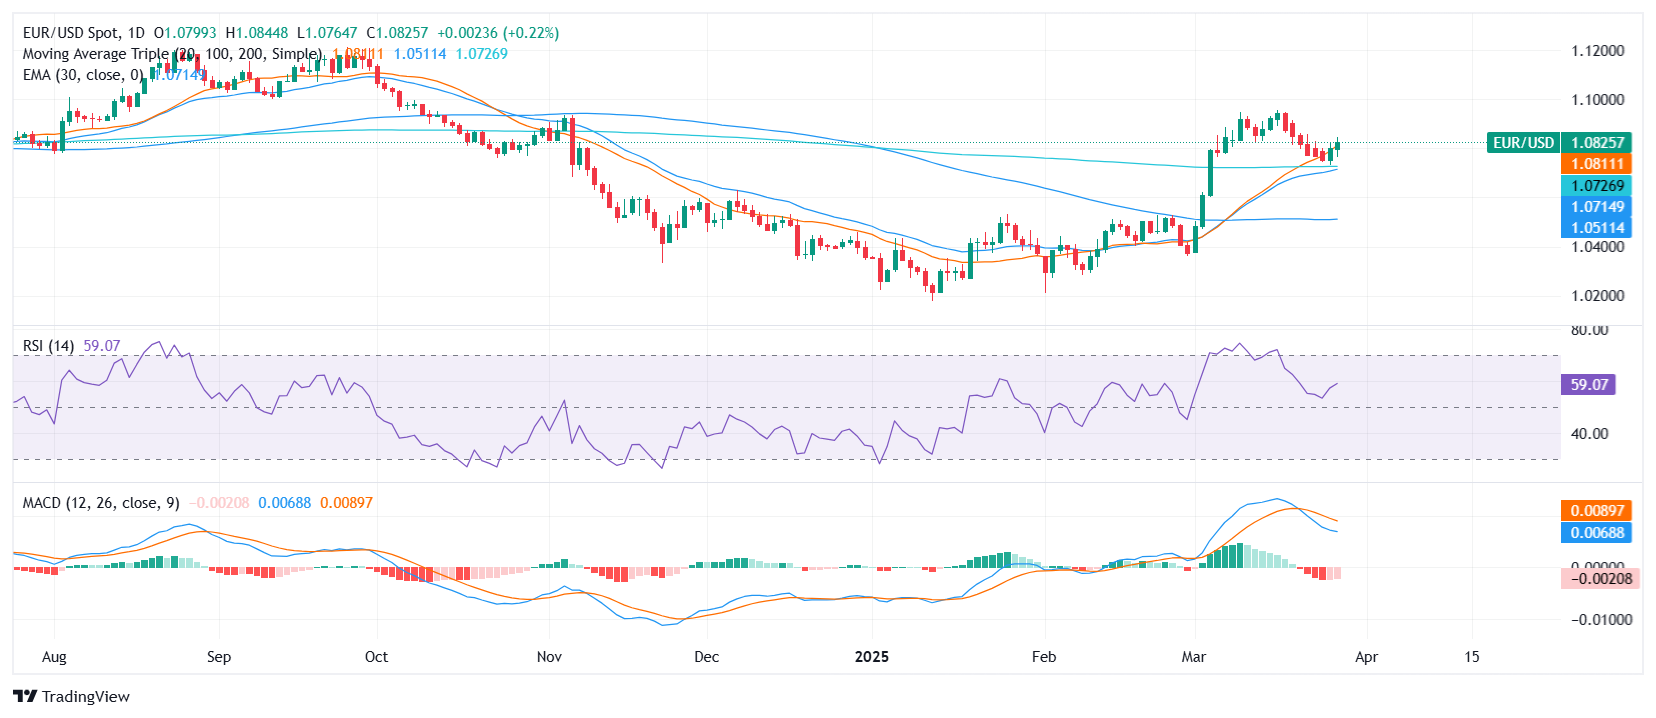
However, the moving averages paint a more optimistic picture. The 20-day Simple Moving Average (SMA) at 1.0791, the 100-day at 1.0518, and the 200-day at 1.0729 all signal buy conditions, reinforcing the prevailing bullish structure. Additional support from the 30-day Exponential Moving Average (1.0709) and SMA (1.0682) further strengthens this view.

On the downside, support levels are located at 1.0810, 1.0791, and 1.0785. Resistance is found near 1.0845, a key area that, if breached, could open the door for an extended move higher. While bullish conditions persist, traders may need to navigate choppy signals from oscillators as the pair consolidates gains.


EUR/USD daily chart

Disclaimer: For information purposes only. Past performance is not indicative of future results.
placeholder
Ethereum (ETH) Price Closes Above $3,900 — Is a New All-Time High Possible Before 2024 Ends?Once again, the price of Ethereum (ETH) has risen above $3,900. This bounce has hinted at a further price increase for the altcoin before the end of the year.
Author  Beincrypto
Dec 17, 2024
Once again, the price of Ethereum (ETH) has risen above $3,900. This bounce has hinted at a further price increase for the altcoin before the end of the year.
placeholder
Markets in 2026: Will gold, Bitcoin, and the U.S. dollar make history again? — These are how leading institutions thinkAfter a turbulent 2025, what lies ahead for commodities, forex, and cryptocurrency markets in 2026?
Author  Insights
Dec 25, 2025
After a turbulent 2025, what lies ahead for commodities, forex, and cryptocurrency markets in 2026?
placeholder
Ethereum Price Forecast: ETH faces heavy distribution as price slips below average cost basis of investorsEthereum (ETH) extended its decline on Wednesday, dropping more than 5% over the past 24 hours toward the $2,100 level, which is below the $2,310 average cost basis or realized price of investors, according to CryptoQuant's data.
Author  FXStreet
Feb 05, Thu
Ethereum (ETH) extended its decline on Wednesday, dropping more than 5% over the past 24 hours toward the $2,100 level, which is below the $2,310 average cost basis or realized price of investors, according to CryptoQuant's data.
placeholder
Bitcoin Drops to $70,000. U.S. Government Refuses to Bail Out Market, End of Bull Market or Golden Pit? The U.S. government refuses to bail out Bitcoin, and with Fed rate cuts nowhere in sight, a continued downward trend to test for a bottom is likely after a brief rebound.During the mid-da
Author  TradingKey
Feb 05, Thu
The U.S. government refuses to bail out Bitcoin, and with Fed rate cuts nowhere in sight, a continued downward trend to test for a bottom is likely after a brief rebound.During the mid-da
placeholder
Bitcoin Surrenders $65,000 as Analysts Warn of ‘Structural’ Market BreakBitcoin plunges 11% to break $65k as analysts term the crash "structural," citing a $1 trillion market wipeout and $2.09 billion in daily liquidations.
Author  Mitrade
Feb 06, Fri
Bitcoin plunges 11% to break $65k as analysts term the crash "structural," citing a $1 trillion market wipeout and $2.09 billion in daily liquidations.
Related Instrument
goTop
quote