EUR/USD Price Analysis: Climbs near daily highs with bullish trend intact

Source Fxstreet
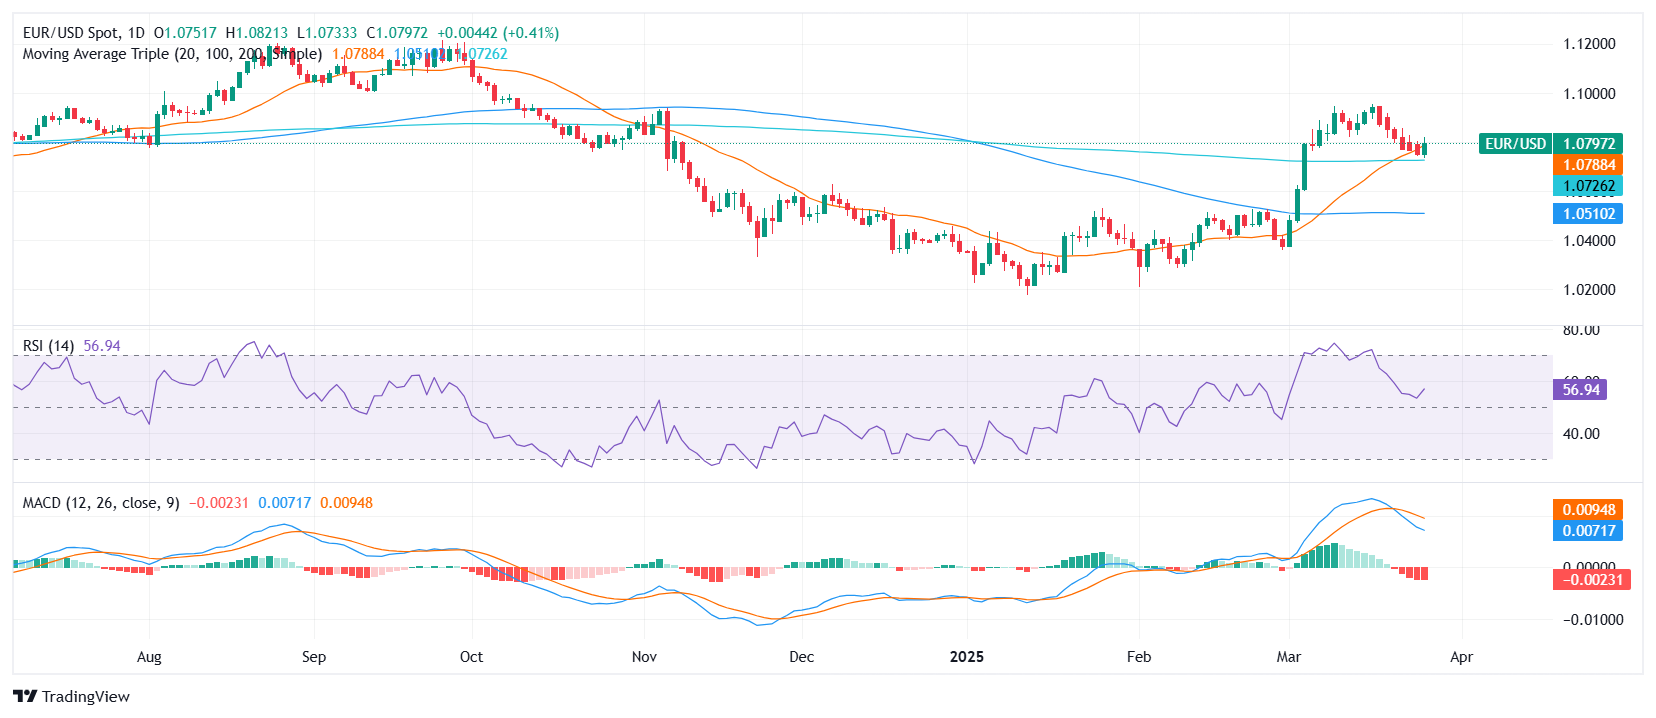
  • EUR/USD was seen trading near the 1.0780 area on Thursday, gaining ground toward the top of its daily range.
  • Despite mixed oscillator signals, the overall setup remains bullish, underpinned by short- and medium-term moving averages.
  • Support rests at 1.0790–1.0760 zone, while resistance appears near 1.0810 and 1.0840.

The EUR/USD pair extended gains on Thursday, moving closer to the top of its daily range near the 1.0780 area after the European session. Price action reflects a broadly bullish bias despite mixed momentum signals, with the pair rising steadily throughout the session, supported by underlying trend indicators.

Technically, the overall signal leans bullish. While the Moving Average Convergence Divergence (MACD) prints a mild sell at 0.007, and the Relative Strength Index (RSI) sits at 51.5 in neutral territory, the 20-day Simple Moving Average (SMA) at 1.0790, 100-day SMA at 1.0518, and 200-day SMA at 1.0729 continue to support the uptrend. Similarly, the 30-day Exponential Moving Average (EMA) and SMA at 1.0709 and 1.0682, respectively, align with bullish momentum.

Other indicators such as the Average Directional Index (ADX) at 26.8 and Commodity Channel Index (CCI) near -7 suggest the trend strength is neutral, reinforcing the idea that further confirmation may be needed before a sustained breakout.

Immediate resistance is seen at 1.0808, followed by a firmer ceiling around 1.0844. On the downside, key support aligns at 1.0790, with further levels at 1.0785 and 1.0764. A clean break above the 1.0810 region could open the path toward higher targets, while failure to hold the support band may prompt a pullback within the bullish structure.


EU/USD daily chart

Disclaimer: For information purposes only. Past performance is not indicative of future results.
placeholder
Tesla Stock Hits Record High as Robotaxi Tests Ignite Market. Why Is Goldman Sachs Pouring Cold Water on Tesla?TradingKey - For Tesla investors, a challenging start to the year has now taken a significant turn.After a 36% stock plunge in the first quarter—its worst performance since 2022—Tesla shares surged ov
Author  TradingKey
11 hours ago
TradingKey - For Tesla investors, a challenging start to the year has now taken a significant turn.After a 36% stock plunge in the first quarter—its worst performance since 2022—Tesla shares surged ov
placeholder
Pound Sterling slumps as UK inflation falls by more than expected to 3.2%The Pound Sterling (GBP) faces intense selling pressure against its major currency peers on Wednesday and slides over 0.5% to near 1.3340 against the US Dollar (USD), following the release of the United Kingdom (UK) Consumer Price Index (CPI) data for November.
Author  FXStreet
12 hours ago
The Pound Sterling (GBP) faces intense selling pressure against its major currency peers on Wednesday and slides over 0.5% to near 1.3340 against the US Dollar (USD), following the release of the United Kingdom (UK) Consumer Price Index (CPI) data for November.
placeholder
XRP’s Price Action Flashes a Warning Even as ETF Flows Stay PositiveXRP’s structure remains weak despite 18 straight positive closes in spot XRP ETFs, with analysts warning that $1.98 and other nearby resistance zones could cap rebounds unless the YO region is reclaimed, while deeper downside scenarios keep $1.53 on watch as a potential (not guaranteed) accumulation area.
Author  Mitrade
15 hours ago
XRP’s structure remains weak despite 18 straight positive closes in spot XRP ETFs, with analysts warning that $1.98 and other nearby resistance zones could cap rebounds unless the YO region is reclaimed, while deeper downside scenarios keep $1.53 on watch as a potential (not guaranteed) accumulation area.
placeholder
Bitcoin-to-Gold Ratio Plummets 50% as Gold Breaks $4,000 in 2025In 2025, gold outpaced Bitcoin, slashing the BTC-to-gold ratio by half from 40 to 20 ounces per BTC.
Author  Mitrade
15 hours ago
In 2025, gold outpaced Bitcoin, slashing the BTC-to-gold ratio by half from 40 to 20 ounces per BTC.
placeholder
December Santa Claus Rally: New highs in sight for US and European stocks?Historical data show a rising trend of US and European stocks in December. If the momentum is strong, fund managers may rush in with a buying frenzy.
Author  Mitrade
19 hours ago
Historical data show a rising trend of US and European stocks in December. If the momentum is strong, fund managers may rush in with a buying frenzy.
goTop
quote