NZD/USD Price Analysis: Kiwi slips as moving average cluster offers key support

Source Fxstreet
  • NZD/USD was seen around the 0.5730 zone, posting modest daily losses ahead of the Asian session.
  • The pair is testing a key confluence of the 20 and 100-day moving averages, with downside risks emerging below this area.

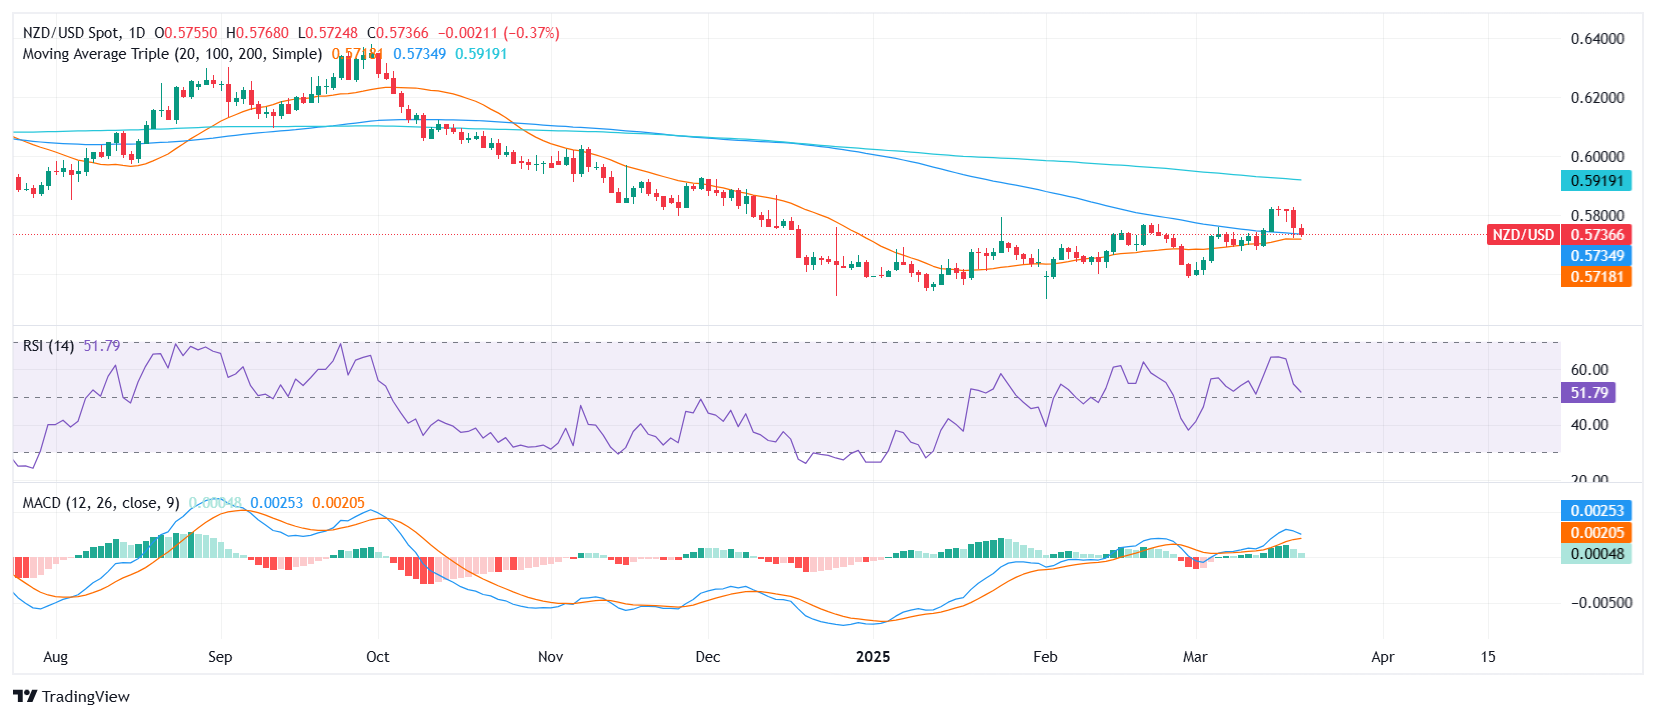
During Friday’s session ahead of the Asian open, NZD/USD declined modestly and was last seen hovering around the 0.5730 area. The pair remains under pressure after sellers stepped in earlier in the day, with price action now centered around the convergence of the 20-day and 100-day Simple Moving Averages—a key technical juncture for the short-term outlook.

The Relative Strength Index (RSI) has sharply dropped but still holds in the positive region, hovering just above the 50 mark, suggesting that bullish momentum is fading. The Moving Average Convergence Divergence (MACD) remains above zero, but its histogram is printing smaller green bars, reflecting weakening upside pressure.

Technically, a clean break below the 0.5730 support area—where the 20-day and 100-day SMAs intersect—could expose the pair to a deeper pullback toward 0.5680 and then the 0.5620 zone. On the flip side, if buyers manage to defend this support cluster, recovery attempts could target resistance around 0.5780 and 0.5820 next.

NZD/USD daily chart
Disclaimer: For information purposes only. Past performance is not indicative of future results.
placeholder
Solana (SOL) Faces Continued Downside Risk—More Losses LikelySolana started a fresh decline from the $155 zone. SOL price is now consolidating near $145 and might extend losses below the $142 support.
Author  NewsBTC
May 06, Tue
Solana started a fresh decline from the $155 zone. SOL price is now consolidating near $145 and might extend losses below the $142 support.
placeholder
Analysts Highlight 4 Reasons Why ETH Price Could Rebound Strongly in MayEthereum (ETH) has declined for five consecutive months. However, it enters May with rising optimism.
Author  Beincrypto
May 07, Wed
Ethereum (ETH) has declined for five consecutive months. However, it enters May with rising optimism.
placeholder
Ethereum Price Ready to Surge—$2,000 Level Could Be Within ReachEthereum price started a fresh increase above the $1,800 zone. ETH is now rising and attempting a move above the $1,850 resistance. Ethereum started a fresh recovery wave above the $1,820 resistance.
Author  NewsBTC
23 hours ago
Ethereum price started a fresh increase above the $1,800 zone. ETH is now rising and attempting a move above the $1,850 resistance. Ethereum started a fresh recovery wave above the $1,820 resistance.
placeholder
Sui Price Forecast: SUI bulls aim for 15% gains as open interest and bullish bets increase among tradersSui (SUI) price extends recent gains, soaring10% higher at the time of writing on Thursday and approaching its key resistance level at $3.65.
Author  FXStreet
18 hours ago
Sui (SUI) price extends recent gains, soaring10% higher at the time of writing on Thursday and approaching its key resistance level at $3.65.
placeholder
Ethereum To ‘Witness Big Breakout’ In The Next Two Weeks If This Level HoldsAs price continues to trade sideways, Ethereum (ETH) has reclaimed a crucial level, which could kickstart a breakout toward the $2,100 resistance.
Author  NewsBTC
18 hours ago
As price continues to trade sideways, Ethereum (ETH) has reclaimed a crucial level, which could kickstart a breakout toward the $2,100 resistance.
Related Instrument
goTop
quote