NZD/USD Price Analysis: Treads water around a psychological level of 0.6200

Source Fxstreet
  • NZD/USD struggles to extend its winning streak amid a bullish momentum on Friday.
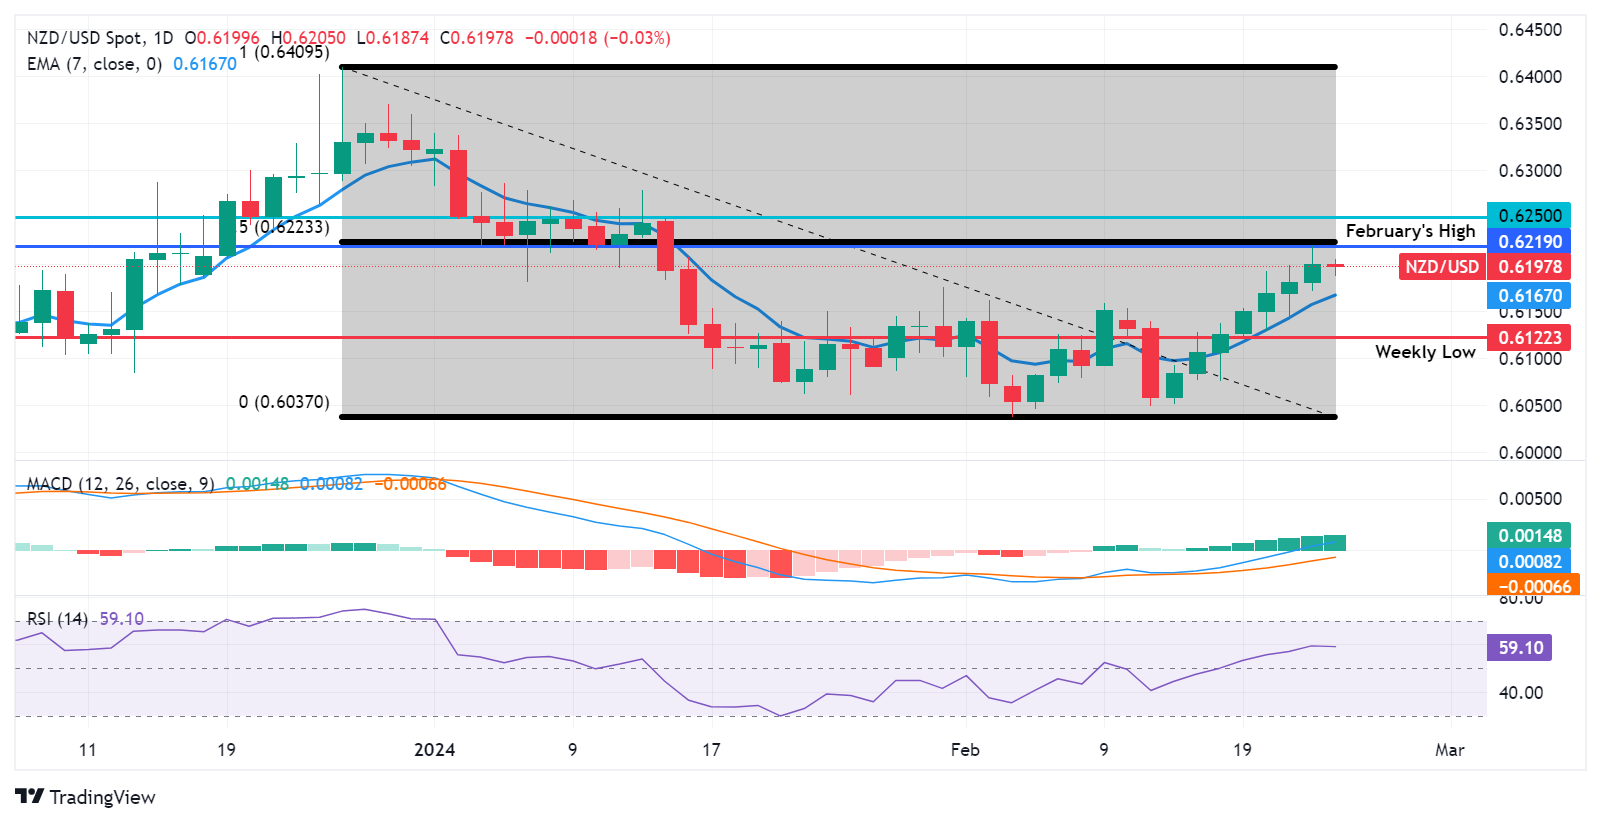
  • The immediate resistance region appears around February’s high at 0.6219 and the 50.0% retracement level of 0.6223.
  • The pair could find the key support region around the seven-day EMA at 0.6167 and the major level of 0.6150.

NZD/USD grapples to extend its winning streak that began on February 14 amid a stable US Dollar. The NZD/USD pair struggles around the psychological level of 0.6200 during the Asian trading hours on Friday.

If the NZD/USD pair surpasses the psychological threshold of 0.6200, it could receive upward support to potentially lead the pair to explore region around the February’s high at 0.6219 and the 50.0% retracement level of 0.6223. A break above this region could exert support for the pair to approach the major resistance of 0.6250 level.

The technical analysis suggests a bullish momentum for the NZD/USD pair. The Moving Average Convergence Divergence (MACD) line is positioned above the centerline, showing divergence above the signal line. Additionally, the 14-day Relative Strength Index (RSI), a lagging indicator, is above the 50 level, suggesting a confirmation of the bullish sentiment.

On the downside, immediate support for the NZD/USD pair is anticipated at the seven-day Exponential Moving Average (EMA) at 0.6167 followed by the major support of 0.6150. A breach below this level could exert downward pressure on the pair, potentially testing the weekly low of 0.6122 to approach the psychological support level of 0.6100.

NZD/USD: Daily Chart


Disclaimer: For information purposes only. Past performance is not indicative of future results.
placeholder
Top 3 Price Prediction: Bitcoin, Ethereum, Ripple – BTC, ETH and XRP Look for a Foothold After a Sharp ShakeoutBitcoin trades near $92,600 after a dip below $90,000, while Ethereum around $3,118 and XRP near $2.21–$2.23 sit on key support zones, as BTC, ETH and XRP all try to turn a sharp correction into a tradable rebound rather than a deeper slide.
Author  Mitrade
Nov 19, Wed
Bitcoin trades near $92,600 after a dip below $90,000, while Ethereum around $3,118 and XRP near $2.21–$2.23 sit on key support zones, as BTC, ETH and XRP all try to turn a sharp correction into a tradable rebound rather than a deeper slide.
placeholder
Bitcoin Volatility Spikes: Is Options-Driven Pricing Making a Comeback?Bitcoin's volatility is surging, suggesting a shift back to options-driven price action seen before Bitcoin ETFs were launched.
Author  Mitrade
Nov 24, Mon
Bitcoin's volatility is surging, suggesting a shift back to options-driven price action seen before Bitcoin ETFs were launched.
placeholder
Gold Price Forecast: XAU/USD rises to near $4,150 as Fed rate cut bets growGold price (XAU/USD) attracts some buyers to around $4,140 during the early Asian session on Tuesday. The precious metal rises on growing expectations of a US Federal Reserve (Fed) interest rate cut in the December policy meeting.
Author  FXStreet
Yesterday 01: 29
Gold price (XAU/USD) attracts some buyers to around $4,140 during the early Asian session on Tuesday. The precious metal rises on growing expectations of a US Federal Reserve (Fed) interest rate cut in the December policy meeting.
placeholder
Bitcoin Bleeds to $86K, But This Key Indicator Screams "The Top Isn't In"Bitcoin’s adjusted Spent Output Profit Ratio (aSOPR) has spent nearly two years coiling below the extremes seen at past bull-market peaks, even as BTC trades around $86,300 and down 9% on the week — a setup that leaves open the possibility that this cycle’s true top may still lie ahead.
Author  Mitrade
Yesterday 07: 27
Bitcoin’s adjusted Spent Output Profit Ratio (aSOPR) has spent nearly two years coiling below the extremes seen at past bull-market peaks, even as BTC trades around $86,300 and down 9% on the week — a setup that leaves open the possibility that this cycle’s true top may still lie ahead.
placeholder
Bitcoin Price Rebound Gains Traction with $90K Break in SightBitcoin is trading above $87,000 and its 100-hour SMA after rebounding from $83,500, with a bearish trend line at $88,200 and resistance at $89,000–$90,000 now in focus as BTC either breaks higher toward $91,750–$94,000 or slips back toward $86,700, $85,000 and lower supports.
Author  Mitrade
9 hours ago
Bitcoin is trading above $87,000 and its 100-hour SMA after rebounding from $83,500, with a bearish trend line at $88,200 and resistance at $89,000–$90,000 now in focus as BTC either breaks higher toward $91,750–$94,000 or slips back toward $86,700, $85,000 and lower supports.
goTop
quote