AUD/USD Price Analysis: Corrects from 0.6600 as US Dollar finds temporary support

Source Fxstreet
  • AUD/USD falls vertically from 0.6600 as the US Dollar gets a firm footing.
  • Deepening geopolitical tensions have improved safe-haven appeal.
  • Fed policymakers are less likely to cut interest rates soon.

The AUD/USD pair falls sharply after a steep rally to the round-level resistance of 0.6600 in the early New York session on Thursday. The Aussie asset faces a sell-off as the US Dollar has rebounded amid deepening Middle East tensions.

The Israeli army has intensified bombarding on Rafah, the southern region of Gaza in Palestine, as the former hopes that over 1.4 million refugees have been sheltered there. Escalating Middle East tensions have improved the appeal for safe-haven assets.

Meanwhile, the Federal Open Market Committee (FOMC) minutes for January’s policy meeting indicated that policymakers don’t want to cut interest rates early amid lack of conviction on the progress in inflation declining to the 2% target.

The Australian Dollar remains bullish lately as the Reserve Bank of Australia (RBA) minutes for February policy meeting indicated that policymakers were interested in raising the Official Cash Rate (OCR) further. It indicates that the current monetary policy of the RBA is not sufficiently restrictive to tame sticky price pressures.

Going forward, investors will focus on the United States preliminary S&P Global PMI data for February, which will be published at 14:45 GMT.

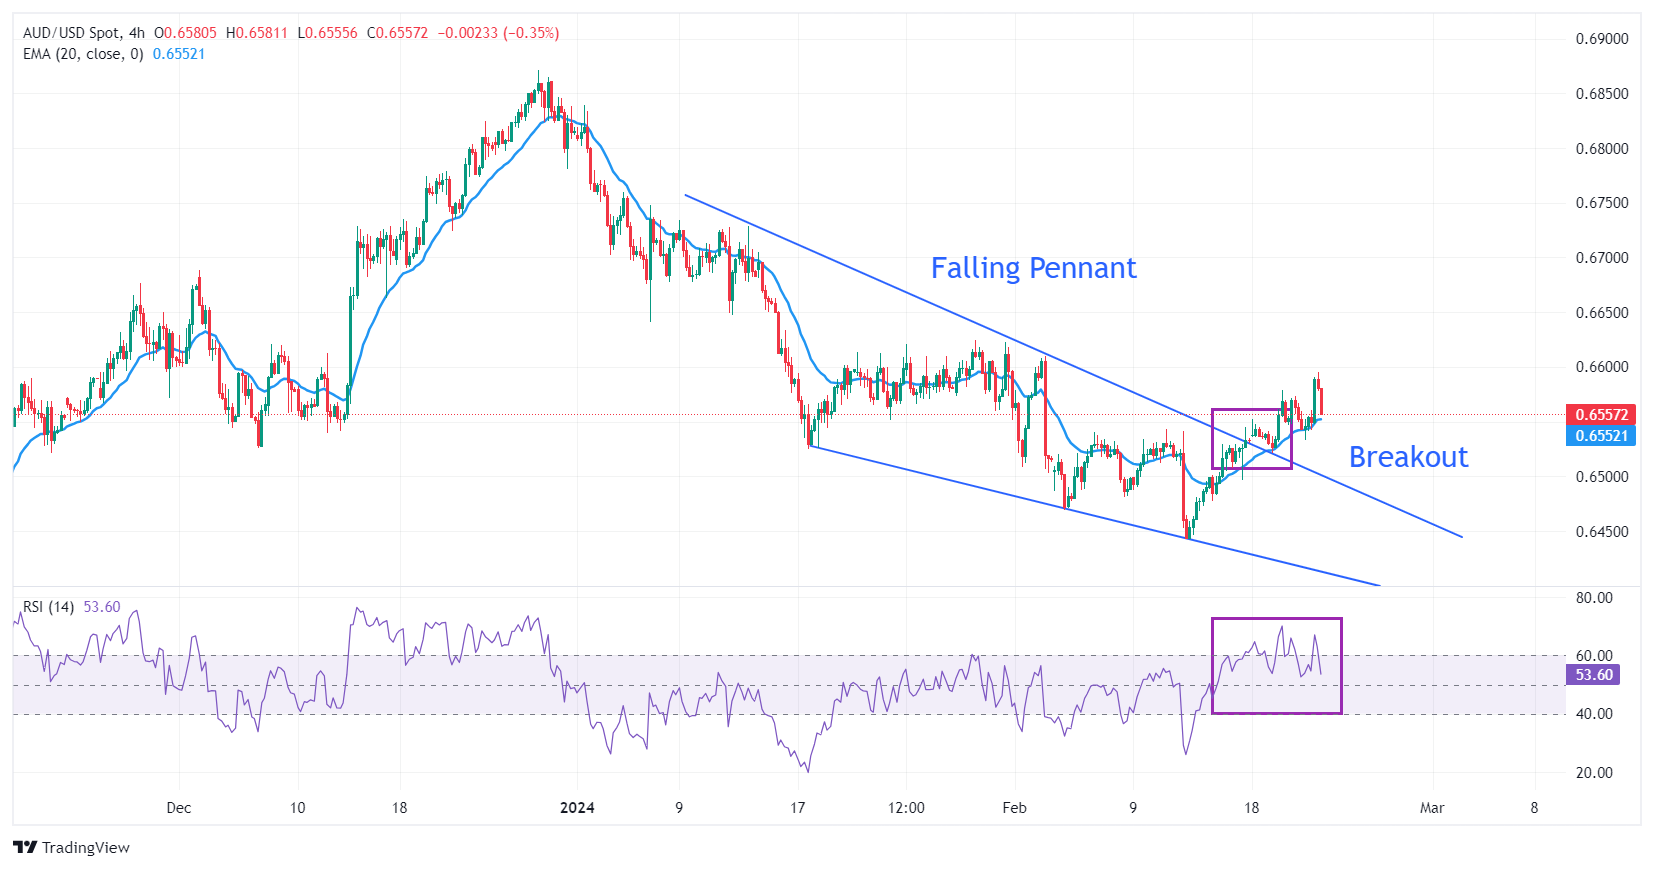
AUD/USD strengthens after a breakout of the Falling Pennant chart pattern formed on a four-hour scale. A breakout of the aforementioned pattern indicates a bullish reversal. The breakout of a Falling Pennant happens when selling pressure dries, and investors consider it a value-buy.

The 20-period Exponential Moving Average (EMA) near 0.6550 continues to provide support to the Australian Dollar bulls.

The 14-period Relative Strength Index (RSI) struggles to sustain in the 60.00-80.00 region. A bullish momentum would trigger if the RSI (14) manages to do so.

Fresh upside would appear if the asset breaks above the round-level resistance of 0.6600, which will drive the asset towards January 30 high at 0.6625, followed by December 4 high at 0.6688.

In an alternate scenario, a downside move below February 15 low at 0.6477 would activate sellers and will expose the asset to February 13 low at 0.6443 and the round-level support of 0.6400.

AUD/USD four-hour chart


Disclaimer: For information purposes only. Past performance is not indicative of future results.
placeholder
BTC Hovers Near 60,000 Mark After Plunge. US May CPI Set to Be Revealed, How Is Wall Street Betting?Bitcoin's rebound falters as the U.S.-Iran conflict and CPI data likely sustain downward pressure.On June 10, escalating U.S.-Iran tensions put the already fragile crypto market to the te
Author  TradingKey
12 hours ago
Bitcoin's rebound falters as the U.S.-Iran conflict and CPI data likely sustain downward pressure.On June 10, escalating U.S.-Iran tensions put the already fragile crypto market to the te
placeholder
Gold plummets below $4,200 as US‑Iran tensions spur hawkish rate bets ahead of US CPIGold (XAU/USD) extends the recent breakdown momentum below a technically significant 200-day Simple Moving Average (SMA) and drops to a fresh low since March 23, further below the $4,200 mark during the Asian session on Wednesday.
Author  FXStreet
13 hours ago
Gold (XAU/USD) extends the recent breakdown momentum below a technically significant 200-day Simple Moving Average (SMA) and drops to a fresh low since March 23, further below the $4,200 mark during the Asian session on Wednesday.
placeholder
Gold Prices Fall for Four Consecutive Months, Has the Precious Metals Bull Market Partially Ended? Where Is the Next Support Level?Gold Prices ( XAUUSD) Slump for Four Consecutive Months: Has the Precious Metals Bull Market Partially Ended? Where Is the Next Support Level?Year-to-date, international gold prices have
Author  TradingKey
14 hours ago
Gold Prices ( XAUUSD) Slump for Four Consecutive Months: Has the Precious Metals Bull Market Partially Ended? Where Is the Next Support Level?Year-to-date, international gold prices have
placeholder
WTI steadies around $87.50 despite renewed supply concernsWest Texas Intermediate (WTI) oil price experiences volatility after registering over 2.5% losses in the previous day, trading around $87.40 per barrel during the Asian hours on Wednesday.
Author  FXStreet
20 hours ago
West Texas Intermediate (WTI) oil price experiences volatility after registering over 2.5% losses in the previous day, trading around $87.40 per barrel during the Asian hours on Wednesday.
placeholder
US May CPI Preview: Rising Inflation May Push Up Fed Rate Hike Expectations, How Will US Stocks, Dollar, Gold React? The U.S. Bureau of Labor Statistics will release May CPI data at 8:30 AM ET on June 10. This report is the most critical inflation reading ahead of the Federal Reserve's policy meeting on
Author  TradingKey
Yesterday 09: 55
The U.S. Bureau of Labor Statistics will release May CPI data at 8:30 AM ET on June 10. This report is the most critical inflation reading ahead of the Federal Reserve's policy meeting on
goTop
quote