NZD/USD Price Analysis: Bulls push higher as pair eyes 100-day SMA

Source Fxstreet
  • NZD/USD surges more than 1% on Friday, reaching its highest level since late January.
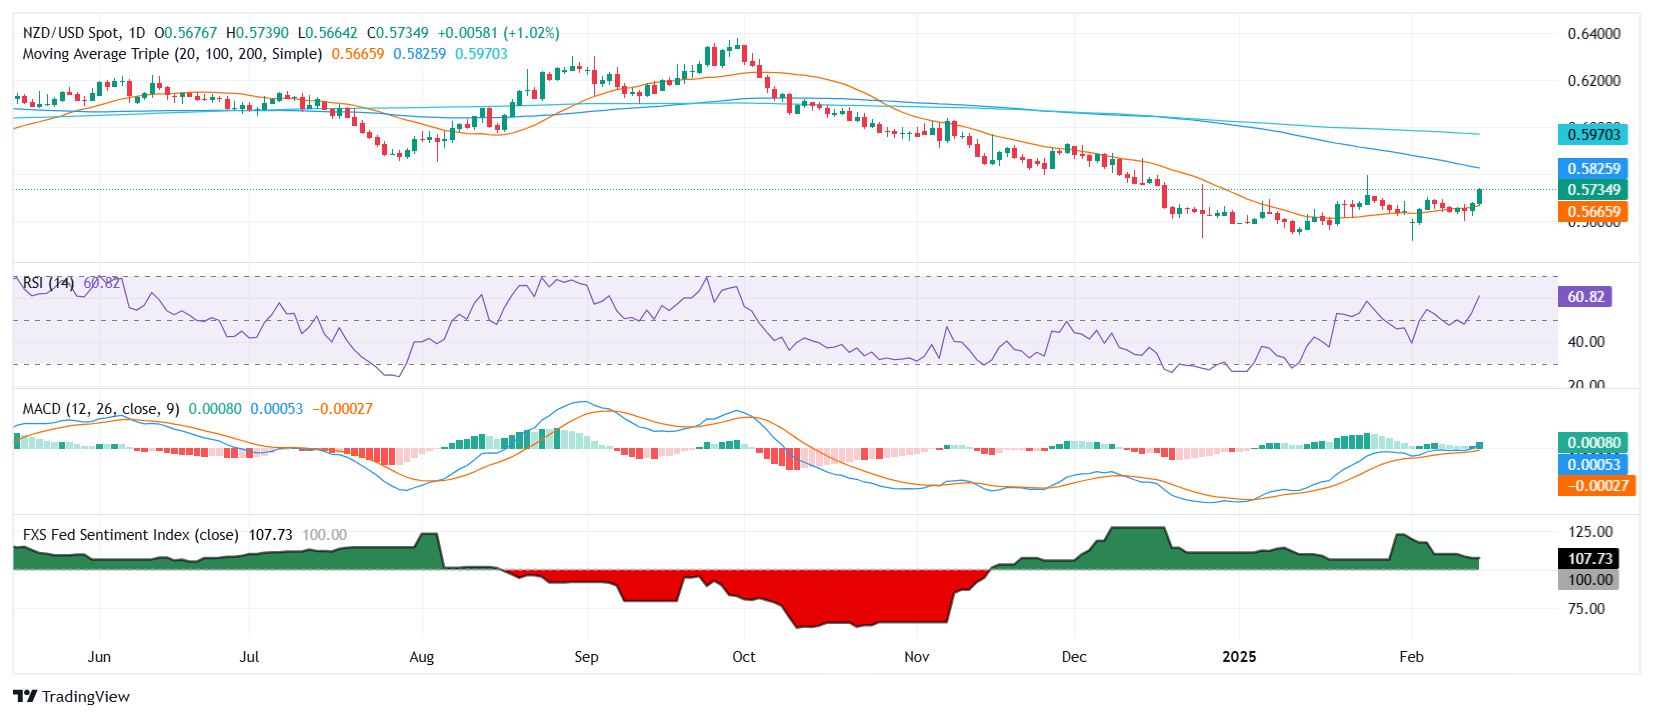
  • The pair extends gains above 0.5730, setting its sights on the 100-day SMA at 0.5825.

The NZD/USD pair rallied on Friday, jumping to 0.5735 and marking a fresh multi-week high. This bullish move reinforces the pair’s recovery from recent lows and suggests a potential shift in sentiment as buyers aim for higher levels. The next significant technical hurdle now lies at the 100-day Simple Moving Average (SMA) near 0.5825, a key level that could determine whether the rally has further room to extend.

Momentum indicators are turning more constructive. The Relative Strength Index (RSI) has climbed sharply to 64, reflecting increased buying pressure and indicating that the pair is approaching overbought conditions. Meanwhile, the Moving Average Convergence Divergence (MACD) histogram remains flat, hinting at a cautious uptrend that may need further confirmation before a sustained breakout.

Looking forward, if NZD/USD clears the 100-day SMA at 0.5825, the next resistance level emerges at 0.5860, a previous support-turned-resistance zone. On the downside, immediate support lies at 0.5700, with a deeper retracement potentially targeting 0.5660, where buyers may look to re-enter.

NZD/USD daily chart

Disclaimer: For information purposes only. Past performance is not indicative of future results.
placeholder
New Fed Chair to Cut Forward Guidance? Warsh Rejects Dot-Plot Expectations, Bullish or Bearish for Bitcoin? If Warsh rejects dot plot projections, it could suppress institutional capital and weaken market risk appetite in the short term, but is a long-term positive for Bitcoin.On June 17, Asian
Author  TradingKey
9 hours ago
If Warsh rejects dot plot projections, it could suppress institutional capital and weaken market risk appetite in the short term, but is a long-term positive for Bitcoin.On June 17, Asian
placeholder
Three Major International Investment Banks Bearish on Oil Outlook, Citi Expects Brent to Fall to $70. Crude Oil Prices Fall for Four Straight Days to Levels at Start of US-Iraq War.On June 16, after US President Donald Trump sent consecutive signals of geopolitical easing, the two major crude oil benchmarks extended their recent declines and are poised to return to
Author  TradingKey
17 hours ago
On June 16, after US President Donald Trump sent consecutive signals of geopolitical easing, the two major crude oil benchmarks extended their recent declines and are poised to return to
placeholder
Japanese Yen hangs near intervention zone despite BoJ rate hike, ahead of FOMCThe USD/JPY pair ticks lower during the Asian session on Wednesday, though it remains within striking distance of the highest level since late April, touched last week.
Author  FXStreet
17 hours ago
The USD/JPY pair ticks lower during the Asian session on Wednesday, though it remains within striking distance of the highest level since late April, touched last week.
placeholder
Has Gold Hit Bottom? Barclays, Citi Both Bullish on Gold, Gold Price Will Return to $5,000 Next Year.Since 2026, gold has erased almost all of its gains and has fallen more than 20% from its record high of $5,595 set at the end of January. Has gold bottomed out? Is now the time to add to
Author  TradingKey
Yesterday 10: 30
Since 2026, gold has erased almost all of its gains and has fallen more than 20% from its record high of $5,595 set at the end of January. Has gold bottomed out? Is now the time to add to
placeholder
WTI hovers around $80.00 as traders await developments on US-Iran peace talksWest Texas Intermediate (WTI) oil price inches higher after registering 3.7% losses in the previous day, trading around $80.10 per barrel during the Asian hours on Tuesday.
Author  FXStreet
Yesterday 01: 19
West Texas Intermediate (WTI) oil price inches higher after registering 3.7% losses in the previous day, trading around $80.10 per barrel during the Asian hours on Tuesday.
Related Instrument
goTop
quote