NZD/JPY Price Analysis: Fresh decline heightens downside risk

Source Fxstreet
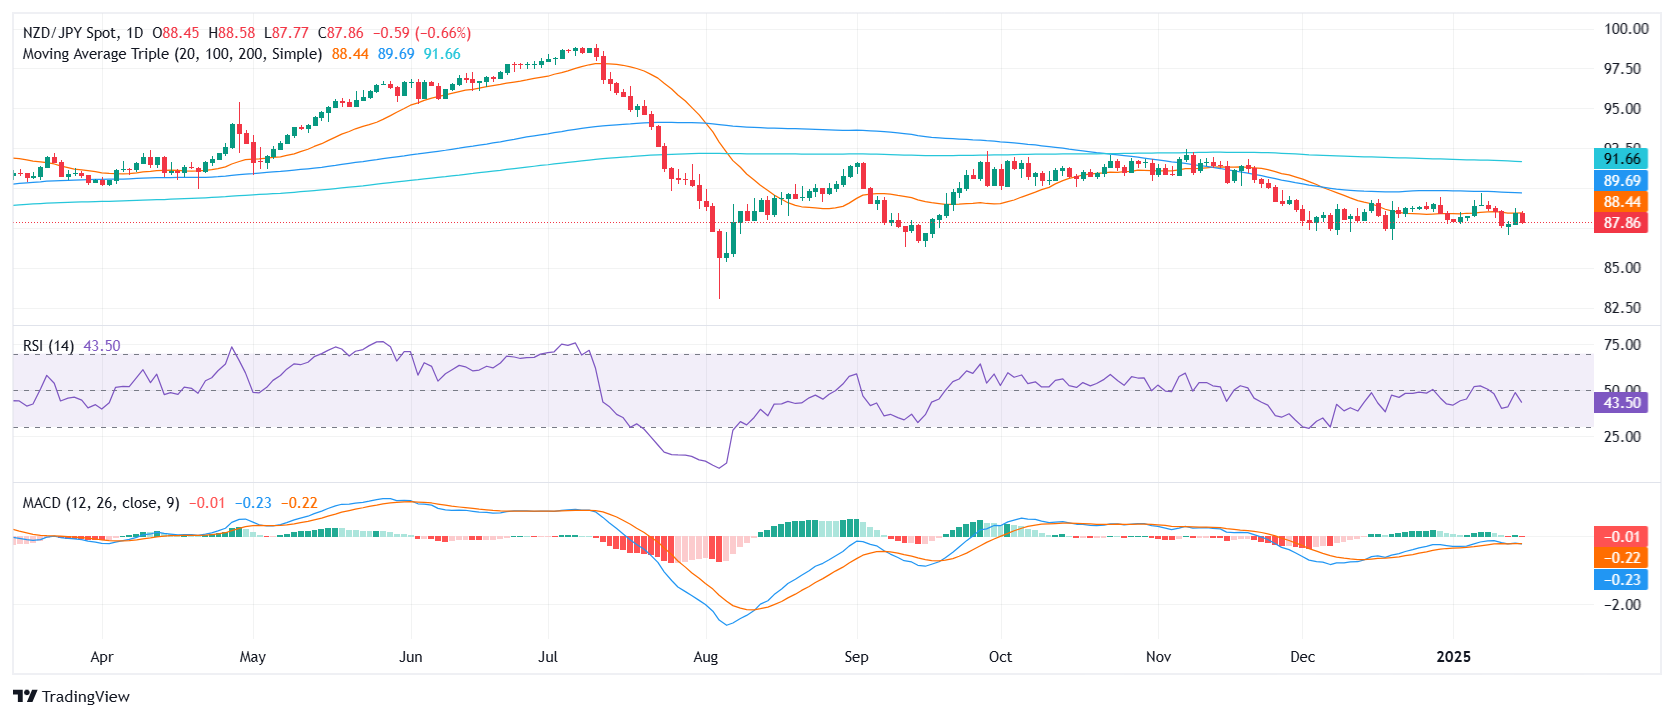
  • NZD/JPY landed near 87.80 after the latest rejection at 89.00.
  • RSI slides to 44 in negative territory, hinting that selling forces may be gaining ground.
  • MACD histogram prints flat red bars, underscoring the pair’s fragile recovery attempts.

The NZD/JPY cross entered deeper negative territory on Wednesday, giving back 0.77% as it settled around 87.80. Sellers took charge following yet another failed effort to conquer the 20-day Simple Moving Average (SMA) near the 89.00 mark. Although the pair had initially shown signs of stabilization within the broader 89.00–87.00 channel, persistent selling pressure has kept it from mounting a convincing rebound.

On the technical front, the Relative Strength Index (RSI) has weakened to 44, reflecting a loss of buying momentum. Similarly, the Moving Average Convergence Divergence (MACD) histogram remains flat and in the red, indicating that the pair’s attempts at recovery lack robust follow-through. This combination of weakening indicators and repeated rejections at 89.00 casts doubt on any near-term upside potential.

As for immediate levels to watch, a drop under 87.50 would place the 87.00 floor under scrutiny, potentially dragging NZD/JPY into deeper territory if selling picks up. In contrast, a clean break above 89.00 remains critical to shifting the short-term bias back toward bullish territory, though buyers seem reluctant to push the market decisively higher at this juncture.

NZD/JPY daily chart
Disclaimer: For information purposes only. Past performance is not indicative of future results.
placeholder
Top 3 Price Prediction: Bitcoin, Ethereum, Ripple – BTC, ETH and XRP Look for a Foothold After a Sharp ShakeoutBitcoin trades near $92,600 after a dip below $90,000, while Ethereum around $3,118 and XRP near $2.21–$2.23 sit on key support zones, as BTC, ETH and XRP all try to turn a sharp correction into a tradable rebound rather than a deeper slide.
Author  Mitrade
Nov 19, Wed
Bitcoin trades near $92,600 after a dip below $90,000, while Ethereum around $3,118 and XRP near $2.21–$2.23 sit on key support zones, as BTC, ETH and XRP all try to turn a sharp correction into a tradable rebound rather than a deeper slide.
placeholder
Bitcoin Volatility Spikes: Is Options-Driven Pricing Making a Comeback?Bitcoin's volatility is surging, suggesting a shift back to options-driven price action seen before Bitcoin ETFs were launched.
Author  Mitrade
Nov 24, Mon
Bitcoin's volatility is surging, suggesting a shift back to options-driven price action seen before Bitcoin ETFs were launched.
placeholder
Gold Price Forecast: XAU/USD rises to near $4,150 as Fed rate cut bets growGold price (XAU/USD) attracts some buyers to around $4,140 during the early Asian session on Tuesday. The precious metal rises on growing expectations of a US Federal Reserve (Fed) interest rate cut in the December policy meeting.
Author  FXStreet
Yesterday 01: 29
Gold price (XAU/USD) attracts some buyers to around $4,140 during the early Asian session on Tuesday. The precious metal rises on growing expectations of a US Federal Reserve (Fed) interest rate cut in the December policy meeting.
placeholder
Bitcoin Bleeds to $86K, But This Key Indicator Screams "The Top Isn't In"Bitcoin’s adjusted Spent Output Profit Ratio (aSOPR) has spent nearly two years coiling below the extremes seen at past bull-market peaks, even as BTC trades around $86,300 and down 9% on the week — a setup that leaves open the possibility that this cycle’s true top may still lie ahead.
Author  Mitrade
20 hours ago
Bitcoin’s adjusted Spent Output Profit Ratio (aSOPR) has spent nearly two years coiling below the extremes seen at past bull-market peaks, even as BTC trades around $86,300 and down 9% on the week — a setup that leaves open the possibility that this cycle’s true top may still lie ahead.
placeholder
Bitcoin Price Rebound Gains Traction with $90K Break in SightBitcoin is trading above $87,000 and its 100-hour SMA after rebounding from $83,500, with a bearish trend line at $88,200 and resistance at $89,000–$90,000 now in focus as BTC either breaks higher toward $91,750–$94,000 or slips back toward $86,700, $85,000 and lower supports.
Author  Mitrade
1 hour ago
Bitcoin is trading above $87,000 and its 100-hour SMA after rebounding from $83,500, with a bearish trend line at $88,200 and resistance at $89,000–$90,000 now in focus as BTC either breaks higher toward $91,750–$94,000 or slips back toward $86,700, $85,000 and lower supports.
goTop
quote