

EUR/JPY Price Forecast: Edges lower to near 162.50; initial support appears at 14-day EMA
- The EUR/JPY cross may regain its ground the daily chart analysis suggests a prevailing bullish bias.
- The bullish bias strengthens as the 14-day RSI remains slightly above the 50 mark.
- The primary support appears at the 14-day EMA at 162.53, followed by the psychological level at 162.50.
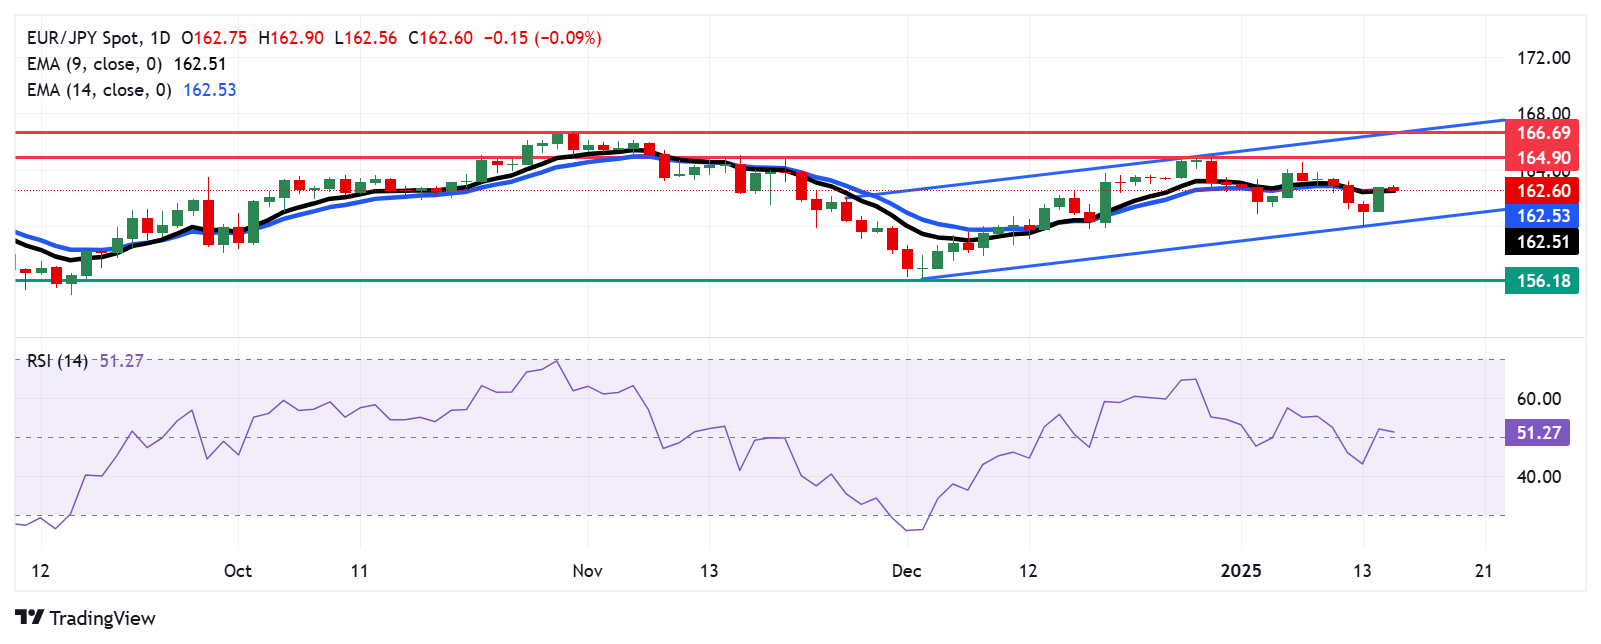
EUR/JPY trades slightly lower, hovering around 162.60 during Wednesday’s Asian trading session, following a 1% gain in the previous session. Technical analysis of the daily chart indicates that the currency cross remains within an ascending channel pattern, reflecting a continued bullish trend.
The 14-day Relative Strength Index (RSI) sits just above the 50 mark, reinforcing the bullish outlook for the EUR/JPY cross. Moreover, the currency cross's position above the nine- and 14-day Exponential Moving Averages (EMAs) highlights improved short-term price momentum and supports the potential for further gains.
On the upside, the EUR/JPY cross may find its primary resistance around its two-month low at the 164.90 level. A break above this level could improve the bullish bias and support the currency cross to approach the upper boundary of the ascending channel at the psychological level of 166.50, followed by a six-month high of 166.69, a level last seen in October 2024.
In terms of support, the EUR/JPY cross may find primary support at the 14-day EMA at 162.53, aligned with the nine-day EMA at 162.51 and psychological level of 162.50. A break below this crucial support zone would weaken the short-term price momentum and put pressure on the currency cross to navigate the region around the ascending channel’s lower boundary around the psychological level of 160.50, followed by a four-month low of 156.18, recorded on December 3.
EUR/JPY: Daily Chart
Euro PRICE Today
The table below shows the percentage change of Euro (EUR) against listed major currencies today. Euro was the weakest against the New Zealand Dollar.
| USD | EUR | GBP | JPY | CAD | AUD | NZD | CHF | |
|---|---|---|---|---|---|---|---|---|
| USD | 0.04% | 0.04% | -0.03% | -0.04% | -0.05% | -0.12% | -0.03% | |
| EUR | -0.04% | 0.00% | -0.08% | -0.09% | -0.10% | -0.16% | -0.07% | |
| GBP | -0.04% | -0.00% | -0.10% | -0.08% | -0.10% | -0.17% | -0.05% | |
| JPY | 0.03% | 0.08% | 0.10% | -0.01% | -0.02% | -0.09% | 0.02% | |
| CAD | 0.04% | 0.09% | 0.08% | 0.00% | -0.02% | -0.09% | 0.03% | |
| AUD | 0.05% | 0.10% | 0.10% | 0.02% | 0.02% | -0.06% | 0.05% | |
| NZD | 0.12% | 0.16% | 0.17% | 0.09% | 0.09% | 0.06% | 0.10% | |
| CHF | 0.03% | 0.07% | 0.05% | -0.02% | -0.03% | -0.05% | -0.10% |
The heat map shows percentage changes of major currencies against each other. The base currency is picked from the left column, while the quote currency is picked from the top row. For example, if you pick the Euro from the left column and move along the horizontal line to the US Dollar, the percentage change displayed in the box will represent EUR (base)/USD (quote).
Recommended Articles


