


Canadian Dollar twists after better-than-expected December jobs figures
- The Canadian Dollar rose on Friday, but still lost ground to the Greenback.
- Canada and the US both added more jobs than expected in December.
- The Canadian Unemployment Rate and wage growth also eased.
The Canadian Dollar (CAD) caught a bid on Friday, getting bolstered across the broader FX market after Canadian jobs figures in December surged well above forecasts. However, a wide surge of risk aversion after US Nonfarm Payrolls (NFP) figures also outperformed forecasts kicked the legs out from under investor rate cut expectations in 2025, sending the safe haven US Dollar broadly higher.
Canadian Net Change in Employment came in at 90.9K, a two-year high for monthly job gains, while US NFP net job additions surged to 256K, also beating the street. Firm job growth in the US will make it difficult for the Fed to deliver more rate cuts, and market bets on Fed rate cuts in 2025 are tumbling.
Daily digest market movers: CAD rises on jobs gains, but Greenback rises faster
- Canada added almost a hundred thousand jobs in December, surging to a two-year single-month hiring splurge. Median market forecasts expected a sharp drop to 25K for the month, below November’s print of 50.5K.
- On the US side, NFP net job gains rose to 256K, well above the forecast 160K, 212K previous.
- Overall, retroactive revisions to datasets remain a key issue: employment survey participation remains low overall, with a respondent rate typically around 50%, leaving lots of room for holes in the reported figures.
- Canadian Average Hourly Wages grew at an annualized rate of 3.7% in December, down slightly from the previous period’s 3.9%.
- The Canadian Unemployment Rate also ticked down to 6.7% from 6.8%; the street expected a move higher to 6.9%.
Canadian Dollar price forecast
Despite a firm print in Canadian job figures, markets are still pivoting into the safety of the Greenback, pushing the Loonie back down. The USD/CAD chart is once again bumping against the ceiling as the US Dollar rises to test multi-year highs against the Canadian Dollar.
USD/CAD is back over the 1.4400 handle, a key barrier for Loonie bulls. It’s a short trip to new multi-year highs near the 1.4500 level, a price the pair hasn’t seen since the pandemic era. Despite a plunge early this week, USD/CAD has pared away nearly all of its losses and is testing back into Monday’s opening bids, leaving room for the CAD to fall further and push the pair into fresh highs.
USD/CAD daily chart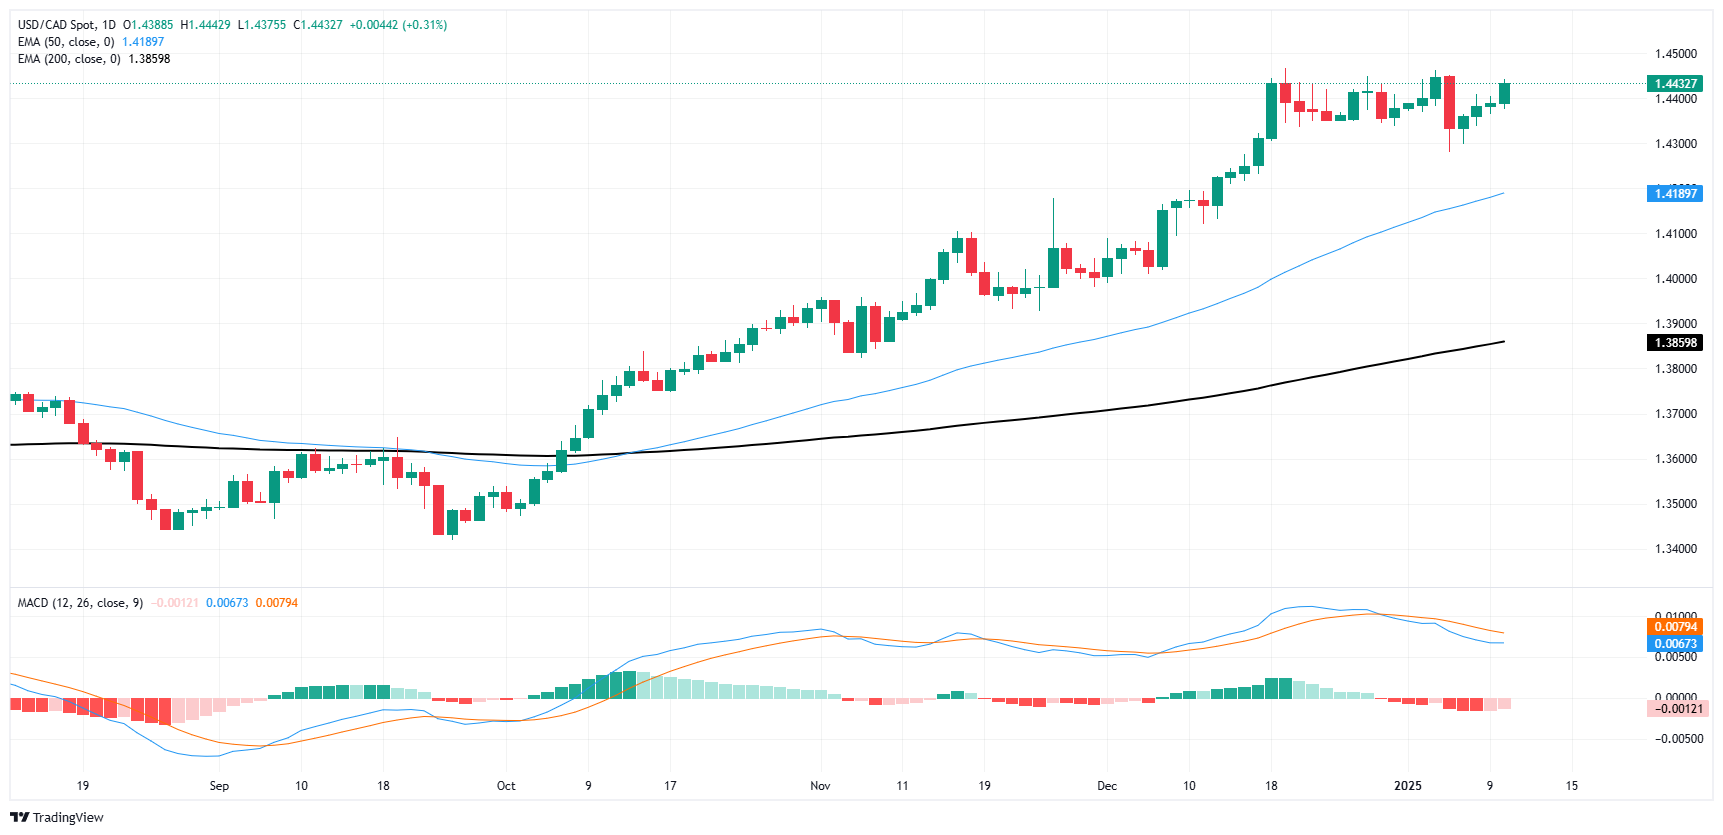
Canadian Dollar FAQs
The key factors driving the Canadian Dollar (CAD) are the level of interest rates set by the Bank of Canada (BoC), the price of Oil, Canada’s largest export, the health of its economy, inflation and the Trade Balance, which is the difference between the value of Canada’s exports versus its imports. Other factors include market sentiment – whether investors are taking on more risky assets (risk-on) or seeking safe-havens (risk-off) – with risk-on being CAD-positive. As its largest trading partner, the health of the US economy is also a key factor influencing the Canadian Dollar.
The Bank of Canada (BoC) has a significant influence on the Canadian Dollar by setting the level of interest rates that banks can lend to one another. This influences the level of interest rates for everyone. The main goal of the BoC is to maintain inflation at 1-3% by adjusting interest rates up or down. Relatively higher interest rates tend to be positive for the CAD. The Bank of Canada can also use quantitative easing and tightening to influence credit conditions, with the former CAD-negative and the latter CAD-positive.
The price of Oil is a key factor impacting the value of the Canadian Dollar. Petroleum is Canada’s biggest export, so Oil price tends to have an immediate impact on the CAD value. Generally, if Oil price rises CAD also goes up, as aggregate demand for the currency increases. The opposite is the case if the price of Oil falls. Higher Oil prices also tend to result in a greater likelihood of a positive Trade Balance, which is also supportive of the CAD.
While inflation had always traditionally been thought of as a negative factor for a currency since it lowers the value of money, the opposite has actually been the case in modern times with the relaxation of cross-border capital controls. Higher inflation tends to lead central banks to put up interest rates which attracts more capital inflows from global investors seeking a lucrative place to keep their money. This increases demand for the local currency, which in Canada’s case is the Canadian Dollar.
Macroeconomic data releases gauge the health of the economy and can have an impact on the Canadian Dollar. Indicators such as GDP, Manufacturing and Services PMIs, employment, and consumer sentiment surveys can all influence the direction of the CAD. A strong economy is good for the Canadian Dollar. Not only does it attract more foreign investment but it may encourage the Bank of Canada to put up interest rates, leading to a stronger currency. If economic data is weak, however, the CAD is likely to fall.
Recommended Articles


