NZD/USD Price Analysis: Pair edges lower to 0.5760 as selling pressure mounts

Source Fxstreet
  • NZD/USD declines on Friday, settling around 0.5760 after trimming earlier gains near 0.5850.
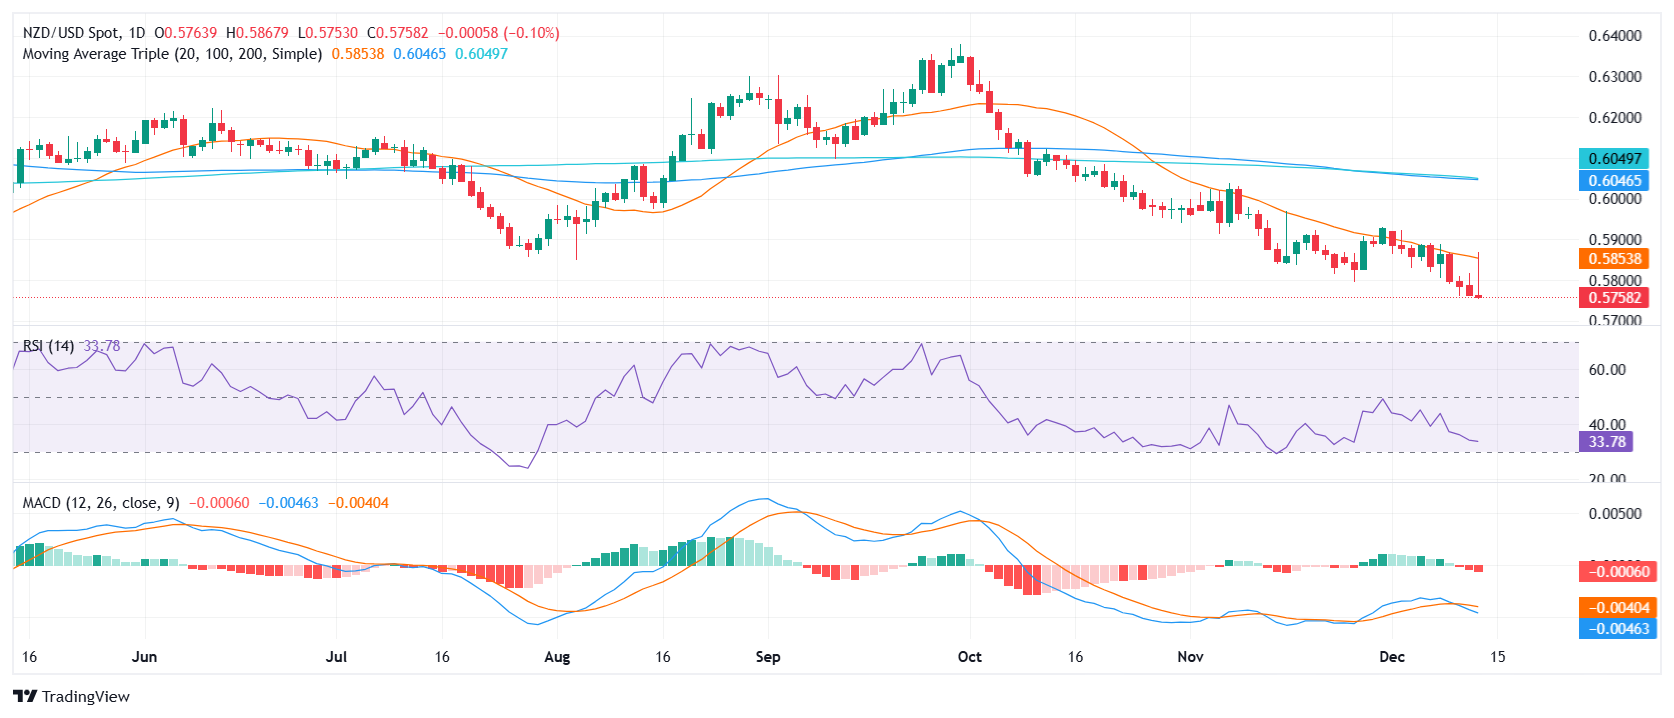
  • Pair remains capped by the 20-day SMA, with upside attempts thwarted by persistent selling pressure.
  • RSI hovers near oversold territory at 34, while MACD histogram prints rising red bars, indicating intensifying bearish momentum.

The NZD/USD pair struggled on Friday, slipping by 0.14% to 0.5760 and failing to hold onto gains that briefly lifted it toward the 0.5850 area. Persistent selling pressure and the inability to break above the 20-day Simple Moving Average (SMA), currently near 0.5890, continue to weigh on the pair’s short-term prospects.

Technical indicators reinforce the bearish outlook. The Relative Strength Index (RSI) stands at 34, nearing oversold conditions, while still pointing downward and reflecting ongoing weakness. Meanwhile, the Moving Average Convergence Divergence (MACD) histogram now prints rising red bars, signaling that bearish momentum is intensifying, despite the pair’s recent attempts at recovery.

With the NZD/USD drifting lower, immediate support lies around the 0.5750 region, followed by the psychological 0.5700 mark if the selling persists. On the upside, a decisive break above the 20-day SMA would be required to negate the current bearish bias and offer the bulls a chance to regain control.

NZD/USD daily chart

Disclaimer: For information purposes only. Past performance is not indicative of future results.
placeholder
Here are all the Trump insiders who sold off billions in stocks before tariff announcementExecutives from some of America’s biggest companies sold off billions of dollars in shares right before Trump’s tariff announcement hit the markets. The trades happened during the first quarter of 2025, as tension built around the White House’s next economic move.
Author  Cryptopolitan
Apr 21, 2025
Executives from some of America’s biggest companies sold off billions of dollars in shares right before Trump’s tariff announcement hit the markets. The trades happened during the first quarter of 2025, as tension built around the White House’s next economic move.
placeholder
Pi Network Price Annual Forecast: PI Heads Into a Volatile 2026 as Utility Questions Collide With Big UnlocksPi Network heads into 2026 after a 90%+ 2025 drawdown from $3.00, with 17.5 million KYC users and a smart-contract-focused Stellar v23 upgrade offering upside potential, but 1.21 billion tokens unlocking and heavy exchange deposits (437 million PI) keeping supply pressure and trust risks firmly in focus.
Author  Mitrade
Dec 19, 2025
Pi Network heads into 2026 after a 90%+ 2025 drawdown from $3.00, with 17.5 million KYC users and a smart-contract-focused Stellar v23 upgrade offering upside potential, but 1.21 billion tokens unlocking and heavy exchange deposits (437 million PI) keeping supply pressure and trust risks firmly in focus.
placeholder
Markets in 2026: Will gold, Bitcoin, and the U.S. dollar make history again? — These are how leading institutions thinkAfter a turbulent 2025, what lies ahead for commodities, forex, and cryptocurrency markets in 2026?
Author  Insights
Dec 25, 2025
After a turbulent 2025, what lies ahead for commodities, forex, and cryptocurrency markets in 2026?
placeholder
ECB Policy Outlook for 2026: What It Could Mean for the Euro’s Next MoveWith the ECB likely holding rates steady at 2.15% and the Fed potentially extending cuts into 2026, EUR/USD may test 1.20 if Eurozone growth proves resilient, but weaker growth and an ECB pivot could pull the pair back toward 1.13 and potentially 1.10.
Author  Mitrade
Dec 26, 2025
With the ECB likely holding rates steady at 2.15% and the Fed potentially extending cuts into 2026, EUR/USD may test 1.20 if Eurozone growth proves resilient, but weaker growth and an ECB pivot could pull the pair back toward 1.13 and potentially 1.10.
placeholder
Gold Suffers Epic Plunge, March Cumulative Decline Exceeds 20%. Has Gold Become a Risk Asset?At 3:21 AM Beijing time during the Asian trading session, Spot gold (XAUUSD) fell nearly 9% intraday, at one point dropping below the $4,100 per ounce mark. This not only erased all gains
Author  TradingKey
Yesterday 10: 58
At 3:21 AM Beijing time during the Asian trading session, Spot gold (XAUUSD) fell nearly 9% intraday, at one point dropping below the $4,100 per ounce mark. This not only erased all gains
Related Instrument
goTop
quote