

EUR/USD Price Forecast: Hovers near 1.0500 post-ECB’s rate cut
- EUR/USD remains tethered to the 1.0500 mark, rebounding slightly to 1.0498 after testing weekly lows.
- Technical analysis shows the pair is in a delicate balance, with potential to challenge resistance if it sustains above 1.0500.
- Key resistances are set at 1.0530 and 1.0600, while supports loom near 1.0452 and the YTD low of 1.0331.
The EUR/USD remains reluctant to remain far from the 1.0500 figure for the fifth consecutive day, even though the ECB decided to cut rates on Thursday, which pushed the pair toward its weekly low of 1.0452. Nevertheless, buyers stepped in and lifted the exchange rate toward the current level of 1.0498.
EUR/USD Price Forecast: Technical outlook
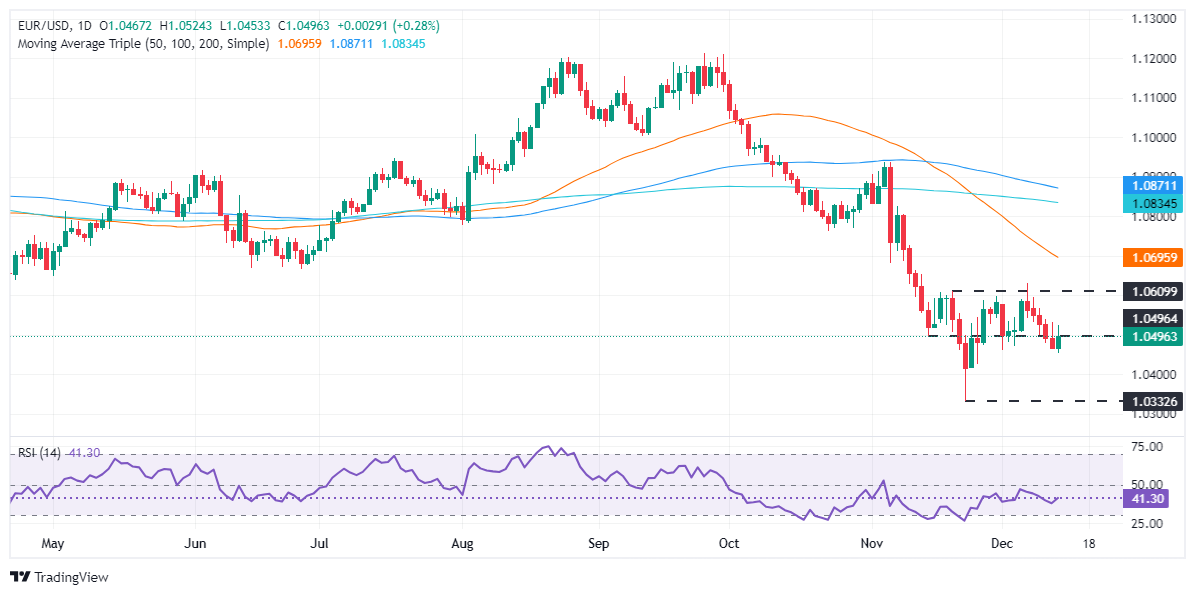
The EUR/USD daily chart suggests the pair hovers near 1.0500, unable to edge lower decisively and retest year-to-date (YTD) low figures at 1.0331. Even though the pair is carving successive series of lower and lower highs, it might be difficult to extend its downtrend.
Momentum, as measured by the Relative Strength Index (RSI), suggests that buyers gain steam. If they achieve a daily close above 1.0500, this can give them a leg-up.
In that outcome, EUR/USD’s key resistance levels lie at the December 12 high of 1.0530, followed by 1.0600 and last week's peak of 1.0629.
On the other hand, if EUR/USD remains below 1.0500, the major could extend its losses, past 1.0452. A breach of the latter will expose the November 26 low of 1.0424, followed by the November 22 swing low of 1.0331.
EUR/USD Price Chart – Daily
Euro PRICE Today
The table below shows the percentage change of Euro (EUR) against listed major currencies today. Euro was the strongest against the Japanese Yen.
| USD | EUR | GBP | JPY | CAD | AUD | NZD | CHF | |
|---|---|---|---|---|---|---|---|---|
| USD | -0.28% | 0.41% | 0.68% | 0.02% | 0.11% | 0.13% | 0.05% | |
| EUR | 0.28% | 0.69% | 0.97% | 0.30% | 0.40% | 0.41% | 0.33% | |
| GBP | -0.41% | -0.69% | 0.27% | -0.38% | -0.30% | -0.28% | -0.36% | |
| JPY | -0.68% | -0.97% | -0.27% | -0.64% | -0.57% | -0.55% | -0.62% | |
| CAD | -0.02% | -0.30% | 0.38% | 0.64% | 0.08% | 0.11% | 0.03% | |
| AUD | -0.11% | -0.40% | 0.30% | 0.57% | -0.08% | 0.02% | -0.06% | |
| NZD | -0.13% | -0.41% | 0.28% | 0.55% | -0.11% | -0.02% | -0.08% | |
| CHF | -0.05% | -0.33% | 0.36% | 0.62% | -0.03% | 0.06% | 0.08% |
The heat map shows percentage changes of major currencies against each other. The base currency is picked from the left column, while the quote currency is picked from the top row. For example, if you pick the Euro from the left column and move along the horizontal line to the US Dollar, the percentage change displayed in the box will represent EUR (base)/USD (quote).
Recommended Articles


