EUR/USD Price Analysis: Pair retreats to 1.0550 after testing 1.0600

Source Fxstreet
  • EUR/USD gives up gains on Friday, settling near 1.0550 after reaching 1.0600.
  • Pair remains above the 20-day SMA, keeping the short-term outlook slightly positive.
  • RSI stays flat in negative territory, while MACD shows rising green bars, hinting at bullish momentum.

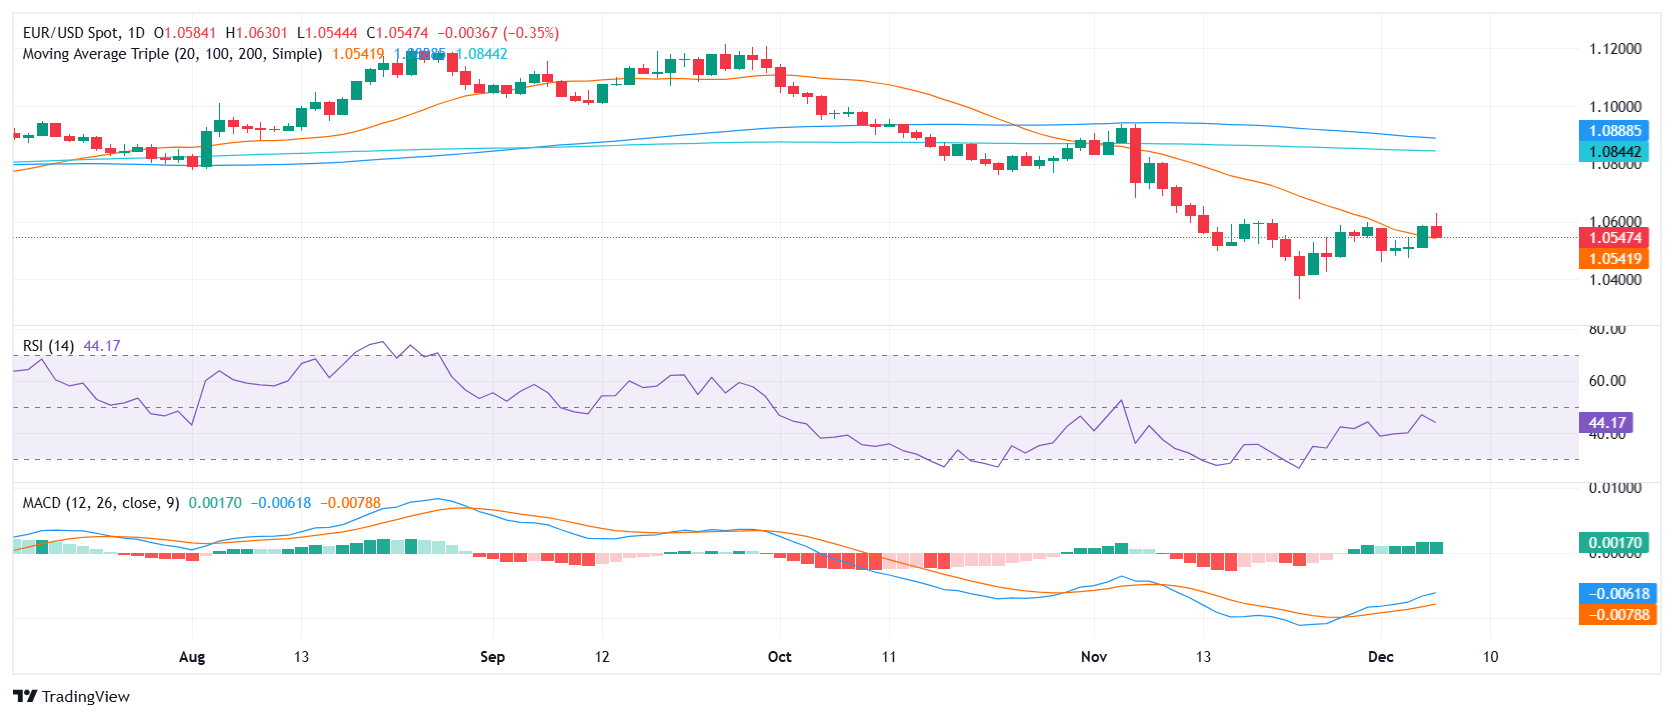
The EUR/USD pair retreated on Friday after briefly testing highs around 1.0600, ending the session near 1.0550 but still holding above the 20-day Simple Moving Average (SMA). This level continues to provide critical support, suggesting that the short-term outlook remains somewhat constructive despite Friday's pullback.

Technical indicators present mixed signals. The Relative Strength Index (RSI) remains points in negative territory, reflecting caution among traders. Meanwhile, the Moving Average Convergence Divergence (MACD) indicator prints rising green bars, signaling gradual bullish momentum. However, the lack of a decisive move higher underscores lingering risks for the pair.

On the upside, the pair faces immediate resistance at 1.0580, with a clear break above the 1.0600 psychological level needed to confirm further gains. On the downside, a sustained move below 1.0550 could open the door to retest support at 1.0530 and potentially revisit the critical 1.0500 level.

EUR/USD daily chart

Disclaimer: For information purposes only. Past performance is not indicative of future results.
placeholder
Bitcoin Price Forecast: BTC battles at key technical zone amid mixed flow signalsBitcoin (BTC) steadies around the key technical support on Tuesday after its recent correction. The Crypto King’s next directional move could hinge on this key technical zone.
Author  FXStreet
10 hours ago
Bitcoin (BTC) steadies around the key technical support on Tuesday after its recent correction. The Crypto King’s next directional move could hinge on this key technical zone.
placeholder
WTI declines below $102.00 after Trump says he called off Iran attacksWest Texas Intermediate (WTI), the US crude oil benchmark, is trading around $101.85 during the early Asian trading hours on Tuesday. The WTI price declines after US President Donald Trump said he was holding off a military attack on Iran planned for Tuesday at the request of Gulf states.
Author  FXStreet
19 hours ago
West Texas Intermediate (WTI), the US crude oil benchmark, is trading around $101.85 during the early Asian trading hours on Tuesday. The WTI price declines after US President Donald Trump said he was holding off a military attack on Iran planned for Tuesday at the request of Gulf states.
placeholder
Iran Situation Rekindles Threat of War. Bitcoin Price Decline Accelerates, $75,000 Geopolitical Defense Line Faces TestU.S.-Israel discussions on resuming strikes against Iran trigger an accelerated Bitcoin price pullback; future gains depend on whether the $75,000 support level holds.On May 18, the poten
Author  TradingKey
Yesterday 09: 03
U.S.-Israel discussions on resuming strikes against Iran trigger an accelerated Bitcoin price pullback; future gains depend on whether the $75,000 support level holds.On May 18, the poten
placeholder
Euro softens to near 1.1600 on US–Iran tensions The EUR/USD pair trades in negative territory around 1.1615 during the early Asian session on Monday. The Euro (EUR) extends the decline as the prolonged US-Iran conflict weighs on the riskier assets.
Author  FXStreet
Yesterday 01: 34
The EUR/USD pair trades in negative territory around 1.1615 during the early Asian session on Monday. The Euro (EUR) extends the decline as the prolonged US-Iran conflict weighs on the riskier assets.
placeholder
Financial Markets 2026: Volatility Catalysts in Gold, Silver, Oil, and Blue-Chip Stocks—A CFD Trader's OutlookGet a comprehensive financial market 2026 outlook exploring key economic drivers, volatility catalysts in gold, oil and stocks, and what the evolving economic outlook means for cfd trading strategies and risk management on global markets.
Author  Rachel Weiss
May 15, Fri
Get a comprehensive financial market 2026 outlook exploring key economic drivers, volatility catalysts in gold, oil and stocks, and what the evolving economic outlook means for cfd trading strategies and risk management on global markets.
Related Instrument
goTop
quote