

GBP/USD Price Forecast: Struggles to crack 1.2700, oscillates around 1.2650
- GBP/USD sees limited movement, fluctuating between 1.2630 and 1.2700 despite breaching the upper boundary briefly.
- Market awaits US Nonfarm Payrolls report, keeping GBP/USD in a consolidation phase with a neutral RSI.
- Potential downside risk if the pair falls below 1.2650, with subsequent supports at 1.2600 and 1.2506.
The GBP/USD fluctuated between gains/loses, trapped at around the 1.2630-1.2700 range for the third consecutive day. Despite cracking 1.2700, buyers remain unable to drive prices higher amid dovish remarks by Bank of England (BoE) Governor Andrew Bailey.
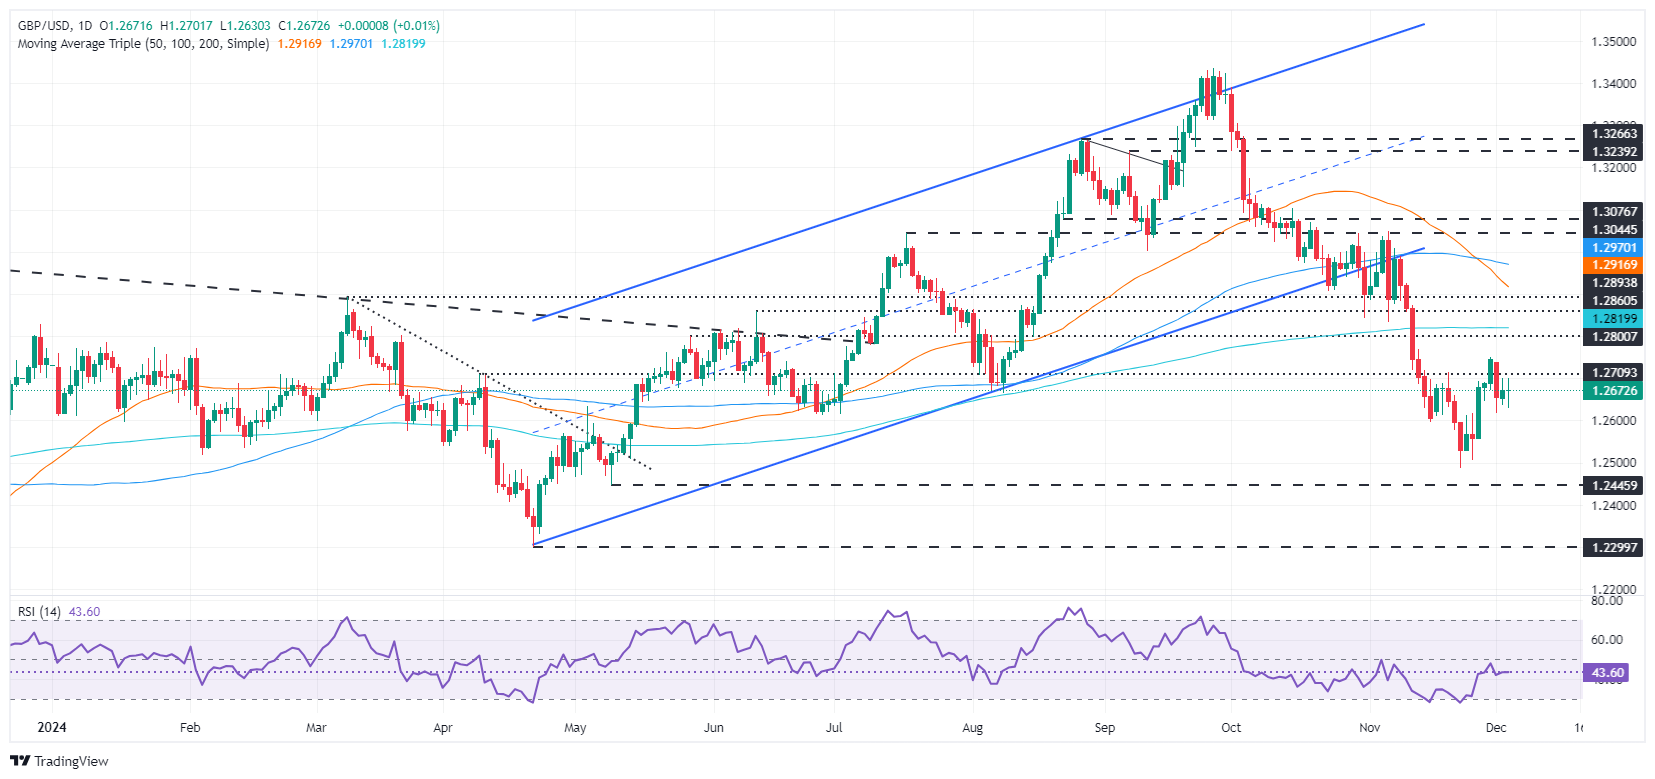
GBP/USD Price Forecast: Technical outlook
The GBP/USD downtrend paused as the pair printed a leg-up towards 1.2749 before dropping below 1.2700. Momentum shows that neither buyers nor sellers are in charge, with the Relative Strength Index (RSI) turning flat at around neutral levels.
This and the GBP/USD consolidation suggest the pair will remain subdued ahead of the crucial US Nonfarm Payrolls report.
If GBP/USD falls below 1.2650, the next support would be 1.2600. Once surpassed, the next stop would be the November 26 low of 1.2506, followed by the November 22 low of 1.2486, ahead of the YTD low of 1.2299.
Conversely, if GBP/USD climbs above 1.2700, look for a test of the 200-day Simple Moving Average (SMA) at 1.2818.
GBP/USD Price Chart – Daily
British Pound PRICE Today
The table below shows the percentage change of British Pound (GBP) against listed major currencies today. British Pound was the strongest against the Australian Dollar.
| USD | EUR | GBP | JPY | CAD | AUD | NZD | CHF | |
|---|---|---|---|---|---|---|---|---|
| USD | 0.11% | -0.00% | 0.94% | -0.00% | 1.12% | 0.69% | 0.04% | |
| EUR | -0.11% | -0.11% | 0.82% | -0.07% | 1.00% | 0.57% | -0.08% | |
| GBP | 0.00% | 0.11% | 0.96% | 0.00% | 1.12% | 0.68% | 0.03% | |
| JPY | -0.94% | -0.82% | -0.96% | -0.94% | 0.17% | -0.27% | -0.91% | |
| CAD | 0.00% | 0.07% | -0.00% | 0.94% | 1.12% | 0.68% | 0.03% | |
| AUD | -1.12% | -1.00% | -1.12% | -0.17% | -1.12% | -0.43% | -1.07% | |
| NZD | -0.69% | -0.57% | -0.68% | 0.27% | -0.68% | 0.43% | -0.65% | |
| CHF | -0.04% | 0.08% | -0.03% | 0.91% | -0.03% | 1.07% | 0.65% |
The heat map shows percentage changes of major currencies against each other. The base currency is picked from the left column, while the quote currency is picked from the top row. For example, if you pick the British Pound from the left column and move along the horizontal line to the US Dollar, the percentage change displayed in the box will represent GBP (base)/USD (quote).
Recommended Articles


