

USD/CAD Price Forecast: Ascending Triangle breakout keep upside trend afloat
- USD/CAD climbs to near 1.4075 ahead of key US data and Fed Powell’s speech.
- Investors should brace for volatility in the CAD as the employmnet data for November is set to release on Friday.
- USD/CAD holds the Ascending Trinagle breakout, suggesting more upside ahead.
The USD/CAD pair extends its winning streak for the third trading day on Wednesday. The Loonie pair moves higher to near 1.4075 as the US Dollar (USD) gains ahead of United States (US) economic data for November, including ADP Employment Change and ISM Services PMI, and Federal Reserve (Fed) Chair Jerome Powell’s speech in the North American session.
The US Dollar Index (DXY), which tracks the Greenback’s value against six major currencies, climbs around 106.60.
Investors will pay close attention to the Jerome Powell’s speech at at the New York Times DealBook Summit to get fresh cues about whether the central bank will cut interest rates again in its policy meeting on December 18. According to the CME FedWatch tool, there is a 74% chance that the Fed will reduce its key borrowing rates by 25 basis points (bps) to 4.25%-4.50%, while the rest favors leaving them unchanged at their current levels.
This week, the Canadian Dollar (CAD) will be influenced by the labor market data for November, which will be released on Friday, along with US Nonfarm Payrolls (NFP).
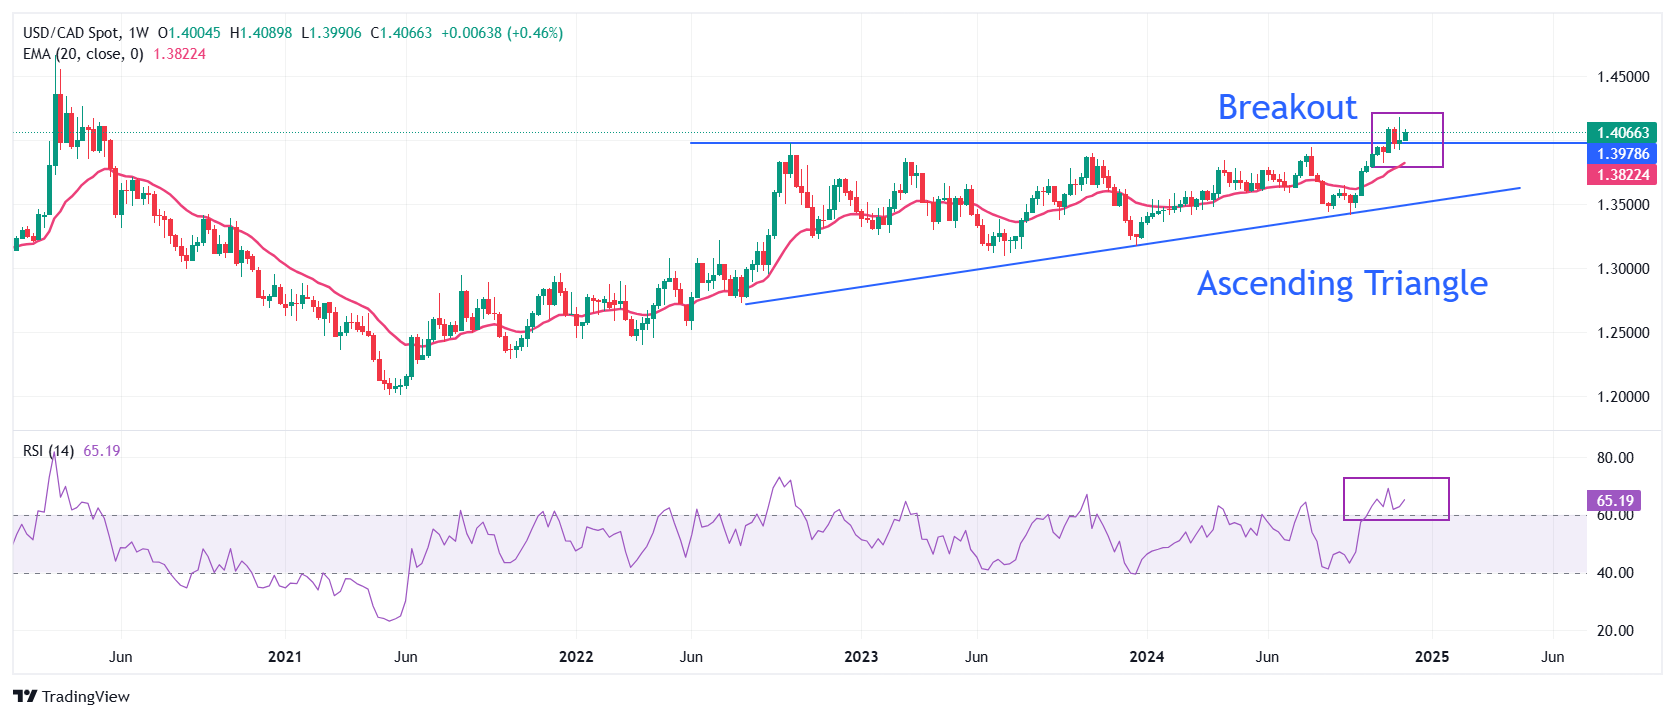
USD/CAD holds the breakout of the Ascending Triangle chart pattern formed on a weekly timeframe. The outlook of the Loonie pair remains firm as the 20-day Exponential Moving Average (EMA) near 1.3820 is sloping higher.
The 14-week Relative Strength Index (RSI) oscillates above 60.00, suggesting a strong bullish momentum.
A fresh upside would appear if the asset breaks above November’s high of 1.4178. The scenario will pave the way for the April 2020 high of 1.4265 and the round-level resistance of 1.4300.
On the contrary, a downside move below the October 29 low of 1.3875 will expose the asset to the October 15 high near 1.3840, followed by the round-level figure of 1.3800.
USD/CAD weekly chart
Economic Indicator
Net Change in Employment
The Net Change in Employment released by Statistics Canada is a measure of the change in the number of people in employment in Canada. Generally speaking, a rise in this indicator has positive implications for consumer spending and indicates economic growth. Therefore, a high reading is seen as bullish for the Canadian Dollar (CAD), while a low reading is seen as bearish.
Read more.Next release: Fri Dec 06, 2024 13:30
Frequency: Monthly
Consensus: 25K
Previous: 14.5K
Source: Statistics Canada
Canada’s labor market statistics tend to have a significant impact on the Canadian dollar, with the Employment Change figure carrying most of the weight. There is a significant correlation between the amount of people working and consumption, which impacts inflation and the Bank of Canada’s rate decisions, in turn moving the C$. Actual figures beating consensus tend to be CAD bullish, with currency markets usually reacting steadily and consistently in response to the publication.
Recommended Articles


