Australian Dollar continues to face downward pressure amid a strong US Dollar

Source Fxstreet
  • The Australian Dollar remains under downward pressure due to recent weak economic data.
  • RBA Governor Bullock stated that current interest rates will remain unchanged until the bank gains confidence in the inflation outlook.
  • Fed Chair Powell noted that US economy performance has been "remarkably good," providing flexibility to ease interest rates gradually.

The Australian Dollar (AUD) continues its decline for the sixth consecutive session on Friday, hovering near three-month lows against the US Dollar (USD). The recent downward trend in the AUD/USD pair is largely due to key economic data from Australia.

However, the decline of the Aussie Dollar may be limited due to less dovish remarks from Reserve Bank of Australia (RBA) Governor Michele Bullock on Thursday. Bullock stated that current interest rates are sufficiently restrictive and will stay at this level until the central bank gains confidence in the inflation outlook.

The US Dollar remains steady near its fresh 2024 highs, despite signs of slowing in "Trump trades." The US Dollar Index (DXY), which tracks the US Dollar’s performance against six major currencies, hovers around 107.06, marking its highest level since November 2023.

Markets are now focused on US October Retail Sales data, set to be released on Friday, along with comments from Federal Reserve officials. On Thursday, Fed Chair Jerome Powell noted that the recent performance of the US economy has been "remarkably good," allowing the Fed room to gradually lower interest rates.

Australian Dollar extends its losing streak as US Dollar surges to fresh 2024 highs

  • The US Producer Price Index (PPI) rose by 2.4% year-over-year in October, up from a revised 1.9% increase in September (previously 1.8%) and surpassing market expectations of 2.3%. Meanwhile, the Core PPI, which excludes food and energy, climbed 3.1% YoY, slightly above the anticipated 3.0%.
  • Australia’s seasonally adjusted unemployment rate held steady at 4.1% in October for the third month in a row, matching market expectations. However, employment change data revealed only 15.9K new jobs added in October, which fell short of the anticipated 25.0K.
  • Australia's Consumer Inflation Expectations dropped to 3.8% in November, down from 4.0% in the previous month, reaching the lowest level since October 2021.
  • Federal Reserve (Fed) Bank of St. Louis President Alberto Musalem commented on Wednesday that persistent inflation challenges make it difficult for the Fed to continue easing rates. Musalem redirected attention to the overall strength of the US labor market, seeking to alleviate concerns about inflation's resistance to the Fed's downward pressure efforts.
  • Federal Reserve Bank of Kansas City President Jeffrey Schmid highlighted potential challenges in lowering interest rates. Schmid also criticized market participants who continue to hold out hope for a return to near-zero rates, calling their expectations unrealistic.
  • US Consumer Price Index (CPI) increased by 2.6% year-over-year in October, in line with market forecasts. Meanwhile, the core CPI, which excludes the more volatile food and energy components, rose by 3.3% as expected.
  • Australia's Prime Minister Anthony Albanese shared in a radio interview on Wednesday that he discussed trade with US President-elect Donald Trump during a phone call last week. Albanese informed Trump that the United States holds a trade surplus with Australia and emphasized that it is in Washington's best interest to "trade fairly" with its ally. Meanwhile, the defense minister underscored Australia's significant investment in security.
  • Last week, China's latest stimulus measures fell short of investor expectations, further dampening demand prospects for Australia’s largest trading partner and weighing on the Australian Dollar. China announced a 10 trillion Yuan debt package to alleviate local government financing pressures and support struggling economic growth. However, the package stopped short of implementing direct economic stimulus measures.

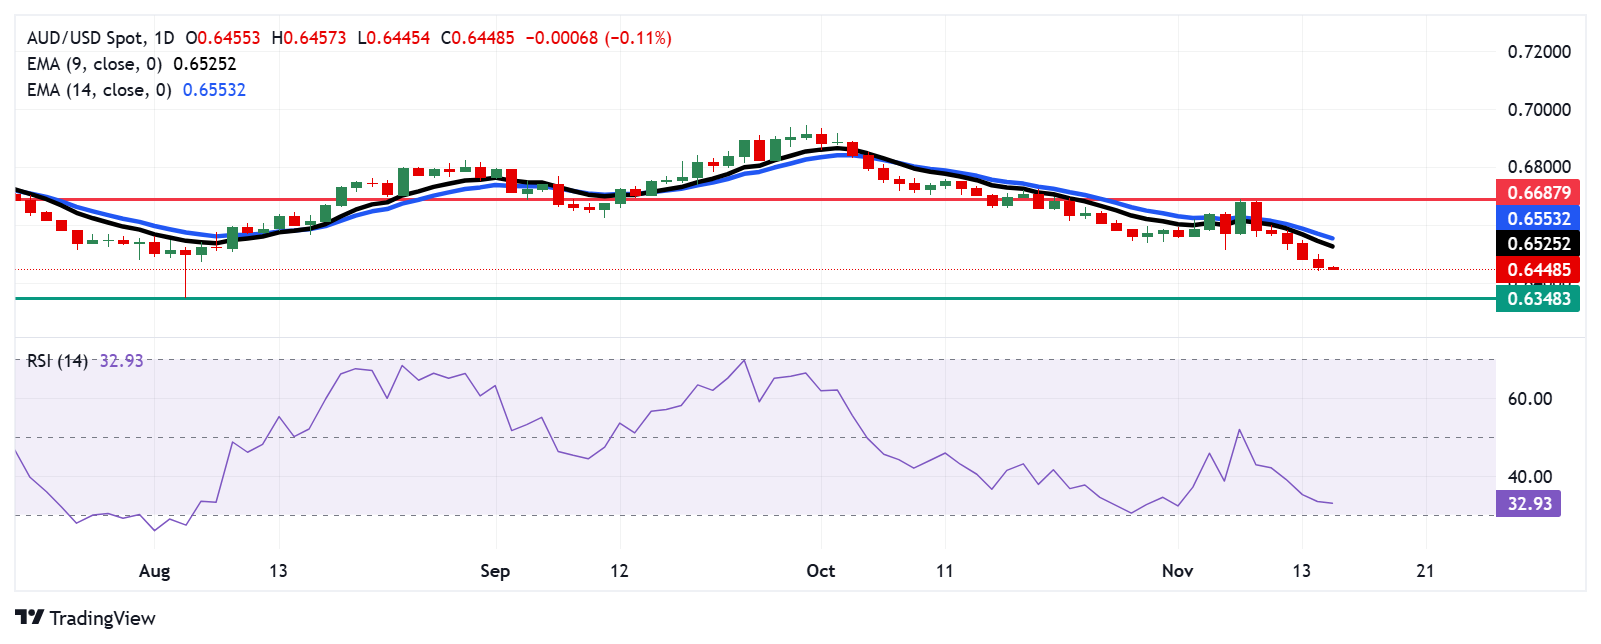
Technical Analysis: Australian Dollar falls to near 0.6500, oversold levels

AUD/USD trades near 0.6460 on Friday. An analysis of the daily chart shows short-term downward pressure, as the pair remains below the nine-day Exponential Moving Average (EMA). Additionally, the 14-day Relative Strength Index (RSI) is slightly above 30, indicating potential oversold conditions. If the RSI dips below 30, it could signal an oversold situation, suggesting a possible upward correction.

The AUD/USD pair may find a key level near 0.6400 for support. A break below this psychological threshold could amplify downward pressure, potentially driving the pair toward the yearly low of 0.6348, last touched on August 5.

The immediate resistance lies at the psychological level of 0.6500. A break above this could lift the pair toward the nine-day EMA at 0.6525, followed by the 14-day EMA at 0.6553. Surpassing these EMAs may pave the way for a move toward the three-week high of 0.6687.

AUD/USD: Daily Chart

Australian Dollar PRICE Today

The table below shows the percentage change of Australian Dollar (AUD) against listed major currencies today. Australian Dollar was the weakest against the Euro.

  USD EUR GBP JPY CAD AUD NZD CHF
USD   -0.13% -0.07% 0.17% 0.00% -0.08% -0.07% -0.12%
EUR 0.13%   0.06% 0.28% 0.15% 0.05% 0.05% 0.02%
GBP 0.07% -0.06%   0.22% 0.09% -0.01% -0.01% -0.05%
JPY -0.17% -0.28% -0.22%   -0.13% -0.25% -0.25% -0.27%
CAD -0.01% -0.15% -0.09% 0.13%   -0.11% -0.09% -0.13%
AUD 0.08% -0.05% 0.01% 0.25% 0.11%   0.00% -0.04%
NZD 0.07% -0.05% 0.00% 0.25% 0.09% -0.01%   -0.04%
CHF 0.12% -0.02% 0.05% 0.27% 0.13% 0.04% 0.04%  

The heat map shows percentage changes of major currencies against each other. The base currency is picked from the left column, while the quote currency is picked from the top row. For example, if you pick the Australian Dollar from the left column and move along the horizontal line to the US Dollar, the percentage change displayed in the box will represent AUD (base)/USD (quote).

Australian Dollar FAQs

One of the most significant factors for the Australian Dollar (AUD) is the level of interest rates set by the Reserve Bank of Australia (RBA). Because Australia is a resource-rich country another key driver is the price of its biggest export, Iron Ore. The health of the Chinese economy, its largest trading partner, is a factor, as well as inflation in Australia, its growth rate and Trade Balance. Market sentiment – whether investors are taking on more risky assets (risk-on) or seeking safe-havens (risk-off) – is also a factor, with risk-on positive for AUD.

The Reserve Bank of Australia (RBA) influences the Australian Dollar (AUD) by setting the level of interest rates that Australian banks can lend to each other. This influences the level of interest rates in the economy as a whole. The main goal of the RBA is to maintain a stable inflation rate of 2-3% by adjusting interest rates up or down. Relatively high interest rates compared to other major central banks support the AUD, and the opposite for relatively low. The RBA can also use quantitative easing and tightening to influence credit conditions, with the former AUD-negative and the latter AUD-positive.

China is Australia’s largest trading partner so the health of the Chinese economy is a major influence on the value of the Australian Dollar (AUD). When the Chinese economy is doing well it purchases more raw materials, goods and services from Australia, lifting demand for the AUD, and pushing up its value. The opposite is the case when the Chinese economy is not growing as fast as expected. Positive or negative surprises in Chinese growth data, therefore, often have a direct impact on the Australian Dollar and its pairs.

Iron Ore is Australia’s largest export, accounting for $118 billion a year according to data from 2021, with China as its primary destination. The price of Iron Ore, therefore, can be a driver of the Australian Dollar. Generally, if the price of Iron Ore rises, AUD also goes up, as aggregate demand for the currency increases. The opposite is the case if the price of Iron Ore falls. Higher Iron Ore prices also tend to result in a greater likelihood of a positive Trade Balance for Australia, which is also positive of the AUD.

The Trade Balance, which is the difference between what a country earns from its exports versus what it pays for its imports, is another factor that can influence the value of the Australian Dollar. If Australia produces highly sought after exports, then its currency will gain in value purely from the surplus demand created from foreign buyers seeking to purchase its exports versus what it spends to purchase imports. Therefore, a positive net Trade Balance strengthens the AUD, with the opposite effect if the Trade Balance is negative.

Disclaimer: For information purposes only. Past performance is not indicative of future results.
placeholder
Ethereum Price Slips Lower — $3,000 Looms as the Key BattlegroundEthereum is attempting to recover from a $3,026 low but remains below $3,200 and the 100-hour SMA, with a bearish trend line near $3,175 capping rebounds as bulls need a clean break above $3,200 to target $3,250–$3,400, while a drop below $3,050 risks a retest of $3,000 and $2,940.
Author  Mitrade
Dec 15, Mon
Ethereum is attempting to recover from a $3,026 low but remains below $3,200 and the 100-hour SMA, with a bearish trend line near $3,175 capping rebounds as bulls need a clean break above $3,200 to target $3,250–$3,400, while a drop below $3,050 risks a retest of $3,000 and $2,940.
placeholder
Bitcoin Slides 5% as Sellers Lean In — Can BTC Reclaim $88,000?Bitcoin has dropped back below $88,000 after rolling over from $90,500, with price still trading under the 100-hour Simple Moving Average. The sell-off found a floor at $85,151, and BTC is now consolidating near that base, but rebounds are facing pressure from a bearish trend line around $89,000. Bulls need to retake $88,000–$89,000 to ease downside risk; failure to do so keeps $85,500–$85,000 and then $83,500 in play, with $80,000 as the deeper “line in the sand.” Bitcoin (BTC) is back in damage-control mode after a sharp pullback wiped out recent gains. The price failed to reclaim the $90,000–$90,500 band, rolled over, and slid through $88,500 before briefly dipping under $87,000. Buyers did show up around $85,000, but the rebound so far looks more like stabilization than a clear trend reversal. Bitcoin dips hard, finds a bid near $85,000(h3) BTC’s latest move lower began when it couldn’t build follow-through above $90,000 and $90,500. Once that upside stalled, sellers took control and pushed price down through $88,500. The slide accelerated enough to spike below $87,000, but the market didn’t free-fall. Bulls defended the $85,000 zone, printing a low at $85,151. Since then, Bitcoin has been consolidating below the 23.6% Fibonacci retracement of the drop from the $93,560 swing high to the $85,151 low — a clue that the bounce is still shallow and that sellers haven’t fully backed off yet. Structurally, BTC is still on the back foot: It’s trading below $88,000, and It remains below the 100-hour Simple Moving Average, keeping short-term trend pressure pointed downward. Resistance is layered, and $89,000 is the problem area(h3) If bulls try to turn this into a recovery, they’ll have to climb through multiple ceilings in quick succession. First, BTC faces resistance around $87,150, followed by a more meaningful barrier near $87,500. From there, the market’s attention snaps back to $88,000 — the level BTC just lost and now needs to reclaim. A close back above $88,000 would improve the tone, but it doesn’t solve the bigger issue: there’s a bearish trend line on the hourly BTC/USD chart (Kraken feed) with resistance near $89,000, which also lines up with the next technical hurdle. If BTC can push through $89,000 and hold, the rebound could extend toward $90,000, with follow-through targets at $91,000 and $91,500. But until price clears that $88,000–$89,000 zone, rallies are at risk of being sold rather than chased. If BTC fails to reclaim resistance, the downside path is clear(h3) The near-term bear case is simple: if Bitcoin can’t climb back above the $87,000 area and keep traction, sellers may attempt another leg lower. Support levels line up like this: Immediate support: $85,500 First major support: $85,000 Next support: $83,500 Then $82,500 in the near term Below that, the major “don’t break this” level is still $80,000. If BTC slips under $80,000, the risk of acceleration to the downside increases significantly — not because it’s magic, but because it’s the kind of psychological and structural level that tends to trigger forced de-risking. Indicators: momentum still leans bearish(h3) The intraday indicators aren’t offering much comfort yet: Hourly MACD is losing pace in the bearish zone. Hourly RSI remains below 50, suggesting sellers still have the upper hand on short timeframes. So while the $85,000 defense held for now, the market hasn’t flipped bullish — it’s just stopped bleeding.
Author  Mitrade
Dec 16, Tue
Bitcoin has dropped back below $88,000 after rolling over from $90,500, with price still trading under the 100-hour Simple Moving Average. The sell-off found a floor at $85,151, and BTC is now consolidating near that base, but rebounds are facing pressure from a bearish trend line around $89,000. Bulls need to retake $88,000–$89,000 to ease downside risk; failure to do so keeps $85,500–$85,000 and then $83,500 in play, with $80,000 as the deeper “line in the sand.” Bitcoin (BTC) is back in damage-control mode after a sharp pullback wiped out recent gains. The price failed to reclaim the $90,000–$90,500 band, rolled over, and slid through $88,500 before briefly dipping under $87,000. Buyers did show up around $85,000, but the rebound so far looks more like stabilization than a clear trend reversal. Bitcoin dips hard, finds a bid near $85,000(h3) BTC’s latest move lower began when it couldn’t build follow-through above $90,000 and $90,500. Once that upside stalled, sellers took control and pushed price down through $88,500. The slide accelerated enough to spike below $87,000, but the market didn’t free-fall. Bulls defended the $85,000 zone, printing a low at $85,151. Since then, Bitcoin has been consolidating below the 23.6% Fibonacci retracement of the drop from the $93,560 swing high to the $85,151 low — a clue that the bounce is still shallow and that sellers haven’t fully backed off yet. Structurally, BTC is still on the back foot: It’s trading below $88,000, and It remains below the 100-hour Simple Moving Average, keeping short-term trend pressure pointed downward. Resistance is layered, and $89,000 is the problem area(h3) If bulls try to turn this into a recovery, they’ll have to climb through multiple ceilings in quick succession. First, BTC faces resistance around $87,150, followed by a more meaningful barrier near $87,500. From there, the market’s attention snaps back to $88,000 — the level BTC just lost and now needs to reclaim. A close back above $88,000 would improve the tone, but it doesn’t solve the bigger issue: there’s a bearish trend line on the hourly BTC/USD chart (Kraken feed) with resistance near $89,000, which also lines up with the next technical hurdle. If BTC can push through $89,000 and hold, the rebound could extend toward $90,000, with follow-through targets at $91,000 and $91,500. But until price clears that $88,000–$89,000 zone, rallies are at risk of being sold rather than chased. If BTC fails to reclaim resistance, the downside path is clear(h3) The near-term bear case is simple: if Bitcoin can’t climb back above the $87,000 area and keep traction, sellers may attempt another leg lower. Support levels line up like this: Immediate support: $85,500 First major support: $85,000 Next support: $83,500 Then $82,500 in the near term Below that, the major “don’t break this” level is still $80,000. If BTC slips under $80,000, the risk of acceleration to the downside increases significantly — not because it’s magic, but because it’s the kind of psychological and structural level that tends to trigger forced de-risking. Indicators: momentum still leans bearish(h3) The intraday indicators aren’t offering much comfort yet: Hourly MACD is losing pace in the bearish zone. Hourly RSI remains below 50, suggesting sellers still have the upper hand on short timeframes. So while the $85,000 defense held for now, the market hasn’t flipped bullish — it’s just stopped bleeding.
placeholder
December Santa Claus Rally: New highs in sight for US and European stocks?Historical data show a rising trend of US and European stocks in December. If the momentum is strong, fund managers may rush in with a buying frenzy.
Author  Mitrade
Yesterday 02: 50
Historical data show a rising trend of US and European stocks in December. If the momentum is strong, fund managers may rush in with a buying frenzy.
placeholder
XRP’s Price Action Flashes a Warning Even as ETF Flows Stay PositiveXRP’s structure remains weak despite 18 straight positive closes in spot XRP ETFs, with analysts warning that $1.98 and other nearby resistance zones could cap rebounds unless the YO region is reclaimed, while deeper downside scenarios keep $1.53 on watch as a potential (not guaranteed) accumulation area.
Author  Mitrade
Yesterday 06: 37
XRP’s structure remains weak despite 18 straight positive closes in spot XRP ETFs, with analysts warning that $1.98 and other nearby resistance zones could cap rebounds unless the YO region is reclaimed, while deeper downside scenarios keep $1.53 on watch as a potential (not guaranteed) accumulation area.
placeholder
Gold declines on profit-taking, USD strength ahead of US CPI releaseGold price (XAU/USD) edges lower below $4,350 during the Asian trading hours on Thursday. The precious metal retreats from seven-week highs amid some profit-taking and a rebound in the US Dollar (USD).
Author  FXStreet
6 hours ago
Gold price (XAU/USD) edges lower below $4,350 during the Asian trading hours on Thursday. The precious metal retreats from seven-week highs amid some profit-taking and a rebound in the US Dollar (USD).
goTop
quote