NZD/USD Price Analysis: Pair gets rejected again by the 20-day SMA, more downside on the horizon

Source Fxstreet
  • The NZD/USD got rejected by the 20-day SMA by the fourth time this week.
  • Technical indicators point to increasing selling pressure and decreasing buying pressure.
  • A breakout from the 0.5940-0.6030 range will confirm a bearish outlook.

In Friday's session, the NZD/USD declined by 1.05% to 0.5960, continuing its downward trend as the pair got rejected by a third time this week by the 20-day Simple Moving Average (SMA).

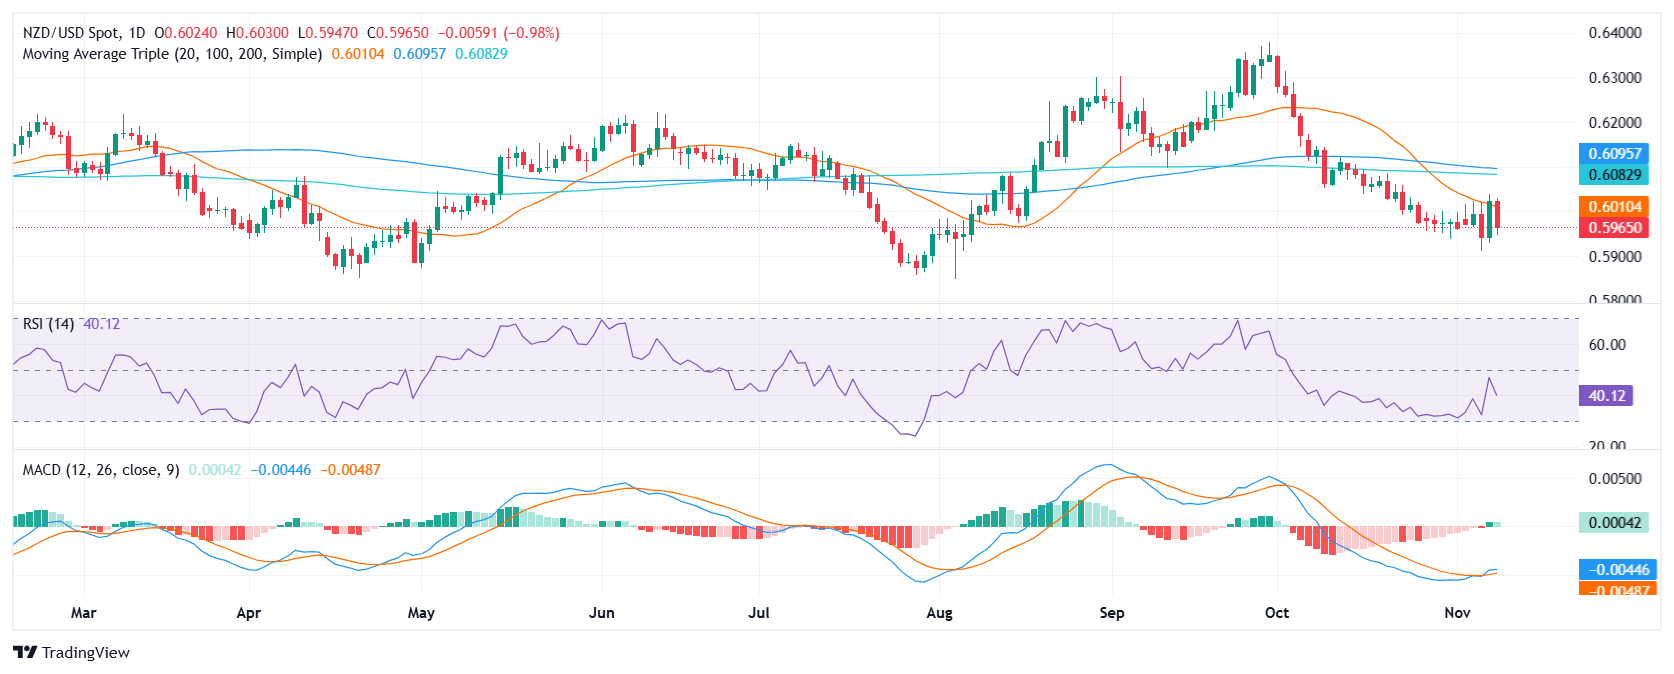
The Relative Strength Index (RSI) is currently at 40 and in negative territory, indicating that selling pressure is rising. The RSI's slope is declining sharply, suggesting that selling pressure is increasing. The Moving Average Convergence Divergence (MACD) is also showing a mixed outlook, with the histogram being green but decreasing, indicating that buying pressure is declining.

The NZD/USD pair faced a third rejection from the 20-day Simple Moving Average (SMA), indicating strong selling pressure. This rejection has pushed the pair lower, suggesting that the downtrend is likely to continue. The multiple rejections of the 20-day SMA highlight the strength of the resistance level and the inability of buyers to break through it. As a result, traders can expect further downside momentum in the near term.

NZD/USD daily chart


Disclaimer: For information purposes only. Past performance is not indicative of future results.
placeholder
Geopolitical Premium Strikes Back. Hormuz Strait Reopening Faces Changes, Bitcoin Barely Holds 70,000 Psychological LevelMiddle East tensions escalate ahead of negotiations, causing Bitcoin to pull back after a surge, with $70,000 becoming the watershed between bulls and bears.On April 9, unexpected develop
Author  TradingKey
11 hours ago
Middle East tensions escalate ahead of negotiations, causing Bitcoin to pull back after a surge, with $70,000 becoming the watershed between bulls and bears.On April 9, unexpected develop
placeholder
Strait of Hormuz Closes Again, When Will Global Energy Supply See Light Again?The outlook for navigation through the Strait of Hormuz remains clouded by uncertainty, as the newly reached ceasefire agreement has failed to bring stability to this global energy choke
Author  TradingKey
11 hours ago
The outlook for navigation through the Strait of Hormuz remains clouded by uncertainty, as the newly reached ceasefire agreement has failed to bring stability to this global energy choke
placeholder
Gold edges lower below $4,750 amid fragile Middle East ceasefire Gold price (XAU/USD) trades in negative territory around $4,705 during the early Asian session on Thursday. The precious metal edges lower amid a temporary two-week ceasefire between the US and Iran.   
Author  FXStreet
11 hours ago
Gold price (XAU/USD) trades in negative territory around $4,705 during the early Asian session on Thursday. The precious metal edges lower amid a temporary two-week ceasefire between the US and Iran.   
placeholder
Gold remains depressed as skepticism over US-Iran truce supports USDGold (XAU/USD) once again shows some resilience below the $4,700 mark during the Asian session on Thursday, and for now, seems to have stalled the previous day's retracement slide from a three-week high.
Author  FXStreet
14 hours ago
Gold (XAU/USD) once again shows some resilience below the $4,700 mark during the Asian session on Thursday, and for now, seems to have stalled the previous day's retracement slide from a three-week high.
placeholder
U.S.-Iran Ceasefire. Bitcoin Surges Past $72,000, 80,000 Within Reach?The U.S.-Iran ceasefire agreement triggered a surge in Bitcoin of over 4%, with the Islamabad negotiations starting this Friday serving as a key driver for further gains.On April 8, a bri
Author  TradingKey
Yesterday 10: 12
The U.S.-Iran ceasefire agreement triggered a surge in Bitcoin of over 4%, with the Islamabad negotiations starting this Friday serving as a key driver for further gains.On April 8, a bri
Related Instrument
goTop
quote