

GBP/USD backslides in broad-market Greenback rally
- GBP/USD fell back below the 1.2900 level as markets pivot into the Greenback.
- Looming BoE rate cut provides little support for Cable.
- Fed due to deliver another rate cut in lockstep with BoE.
GBP/USD tumbled back below the 1.2900 handle on Wednesday as markets splurged on Greenback bids following the one-sided outcome of the US presidential election. The Bank of England (BoE) and the Federal Reserve (Fed) are both due to deliver matching quarter-point rate cuts on Thursday.
The US presidential election still isn’t over, and some key battlegrounds will take some time before a final call is made. Still, markets are confident that the outcome has been decided, with Republican candidate and former President Donald Trump set to win 276 electoral votes. With the Republicans also set to win back both the US Senate and Congress, investors are anticipating a pro-growth environment with more deregulation as well as additional or extended business tax cuts.
Despite a steady stream of inflationary rhetoric from former President Donald Trump on the campaign trail, investors are viewing a Trump win as a net positive for markets, piling into risk assets as well as the Greenback during the midweek market session.
The BoE’s latest rate call, slated for Thursday, is expected to deliver another quarter-point cut to investors. The BoE’s Monetary Policy Committee is expected to vote seven-to-two to reduce the BoE’s main reference rate to 4.75% from the current 5.0%.
Another Fed rate call looms ahead this week. Fed Chair Jerome Powell is widely expected to deliver another quarter-point cut to interest rates on Thursday, bringing the Fed Funds Rate down 25 bps to 4.75%. The Fed Funds Rate peaked at 5.5% in July of 2023, and investors have been clamoring for a return to a low interest rate environment that has become familiar territory since US interest rates clattered to an all-time low near 0% in early 2009.
The University of Michigan’s (UoM) Consumer Sentiment Index is waiting in the wings and slated for release on Friday. Investors expect November’s UoM sentiment indicator to climb to a six-month high of 71.0 from the previous month’s 70.5.
GBP/USD price forecast
The GBP/USD daily chart reveals a bearish sentiment as the currency pair tests support around the 200-day EMA, which is currently situated at 1.2858. After an attempt to break above the 50-day EMA (currently at 1.3038), GBP/USD faced a sharp rejection, indicating selling pressure at higher levels. The strong red candle on the latest trading day suggests that the bulls struggled to sustain momentum above 1.3000, leading to a decisive pullback. This price action underscores the significance of the 1.2850-1.2900 zone as a key support area, as a break below it could signal further downside.
Additionally, the MACD indicator at the bottom of the chart is displaying a bearish crossover, as the MACD line has dipped below the signal line. The histogram bars have turned red, reinforcing the downward momentum. Although the MACD is still close to the zero line, suggesting a potentially limited downside, the negative sentiment persists. If the MACD momentum accelerates further into negative territory, it would strengthen the bearish outlook for the GBP/USD pair, likely pushing prices toward lower support levels around 1.2700.
In the event of a bounce from the 200-day EMA, the bulls would need to reclaim the 50-day EMA at 1.3038 to shift the short-term bias back to bullish. A close above this level could invite further buying interest, potentially targeting the recent high around 1.3300. However, with the recent bearish crossover in the MACD and price action failing to sustain above 1.3000, the path of least resistance appears to be downward. Traders should monitor the 1.2850 level closely, as a decisive break below could accelerate selling pressure, with the pair likely targeting the 1.2700 handle in the coming sessions.
GBP/USD daily chart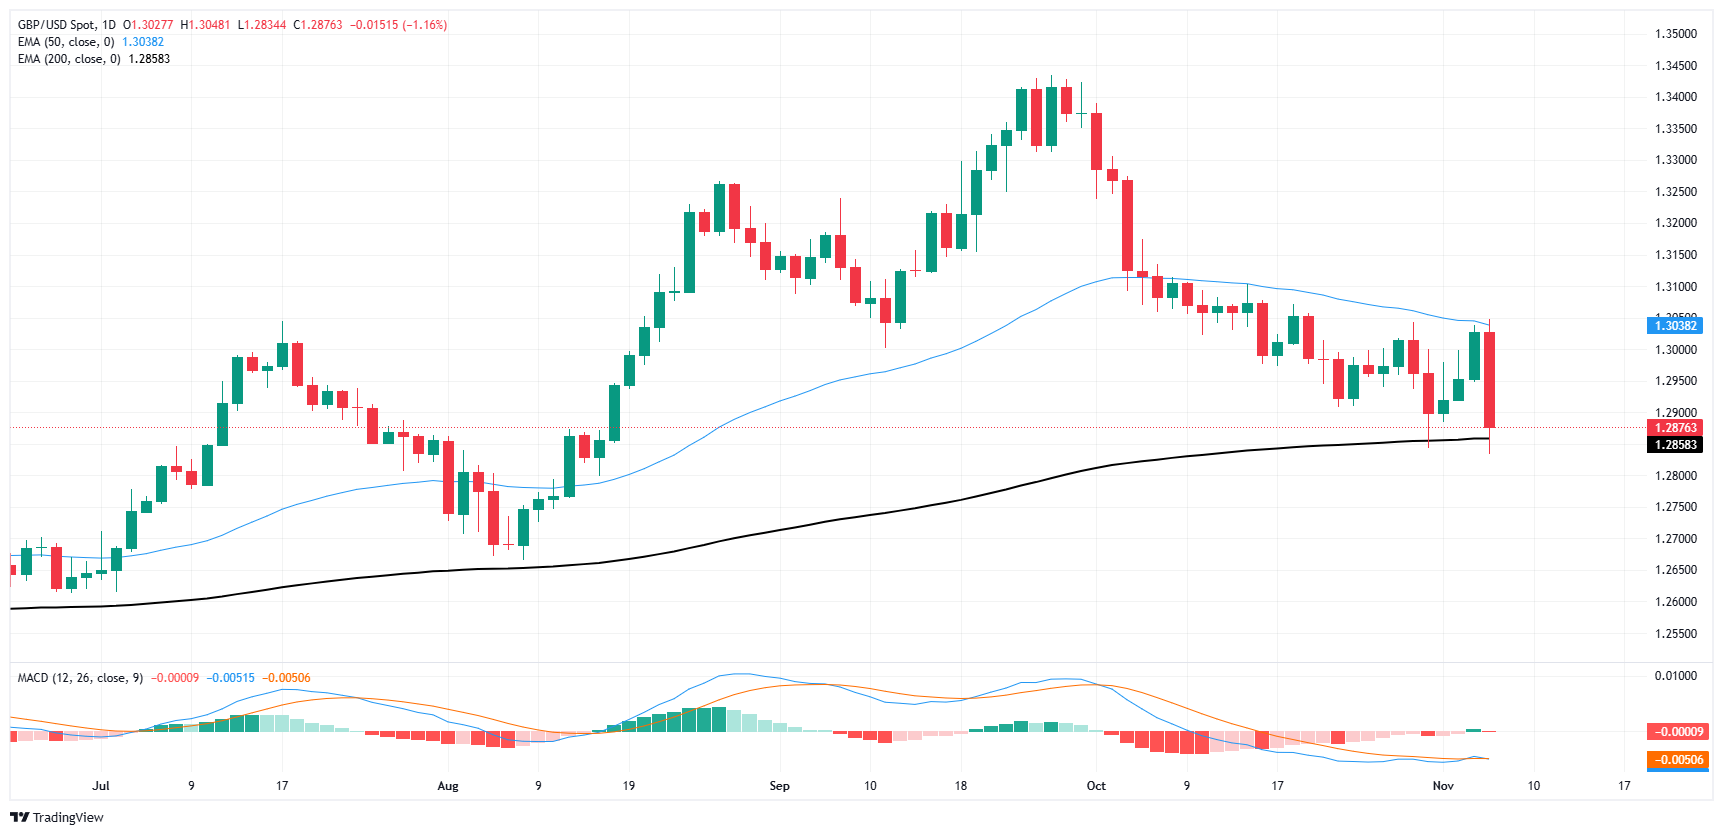
Pound Sterling FAQs
The Pound Sterling (GBP) is the oldest currency in the world (886 AD) and the official currency of the United Kingdom. It is the fourth most traded unit for foreign exchange (FX) in the world, accounting for 12% of all transactions, averaging $630 billion a day, according to 2022 data. Its key trading pairs are GBP/USD, also known as ‘Cable’, which accounts for 11% of FX, GBP/JPY, or the ‘Dragon’ as it is known by traders (3%), and EUR/GBP (2%). The Pound Sterling is issued by the Bank of England (BoE).
The single most important factor influencing the value of the Pound Sterling is monetary policy decided by the Bank of England. The BoE bases its decisions on whether it has achieved its primary goal of “price stability” – a steady inflation rate of around 2%. Its primary tool for achieving this is the adjustment of interest rates. When inflation is too high, the BoE will try to rein it in by raising interest rates, making it more expensive for people and businesses to access credit. This is generally positive for GBP, as higher interest rates make the UK a more attractive place for global investors to park their money. When inflation falls too low it is a sign economic growth is slowing. In this scenario, the BoE will consider lowering interest rates to cheapen credit so businesses will borrow more to invest in growth-generating projects.
Data releases gauge the health of the economy and can impact the value of the Pound Sterling. Indicators such as GDP, Manufacturing and Services PMIs, and employment can all influence the direction of the GBP. A strong economy is good for Sterling. Not only does it attract more foreign investment but it may encourage the BoE to put up interest rates, which will directly strengthen GBP. Otherwise, if economic data is weak, the Pound Sterling is likely to fall.
Another significant data release for the Pound Sterling is the Trade Balance. This indicator measures the difference between what a country earns from its exports and what it spends on imports over a given period. If a country produces highly sought-after exports, its currency will benefit purely from the extra demand created from foreign buyers seeking to purchase these goods. Therefore, a positive net Trade Balance strengthens a currency and vice versa for a negative balance.
Recommended Articles


