GBP/CAD Price Prediction: Price flirts with lower boundary line of Rising Wedge pattern

Source Fxstreet
  • GBP/CAD falls to the lower boundary of a bearish price pattern. 
  • A clean break lower could indicate the start of a new downtrending cycle. 

GBP/CAD falls to the lower boundary line of a Rising Wedge pattern and the level of the (red) 50-day Simple Moving Average (SMA) at about 1.7826. Rising Wedges are usually bearish patterns, however, there is no way of confirming this is such a pattern, although it looks very much like one.

GBP/CAD Daily Chart 
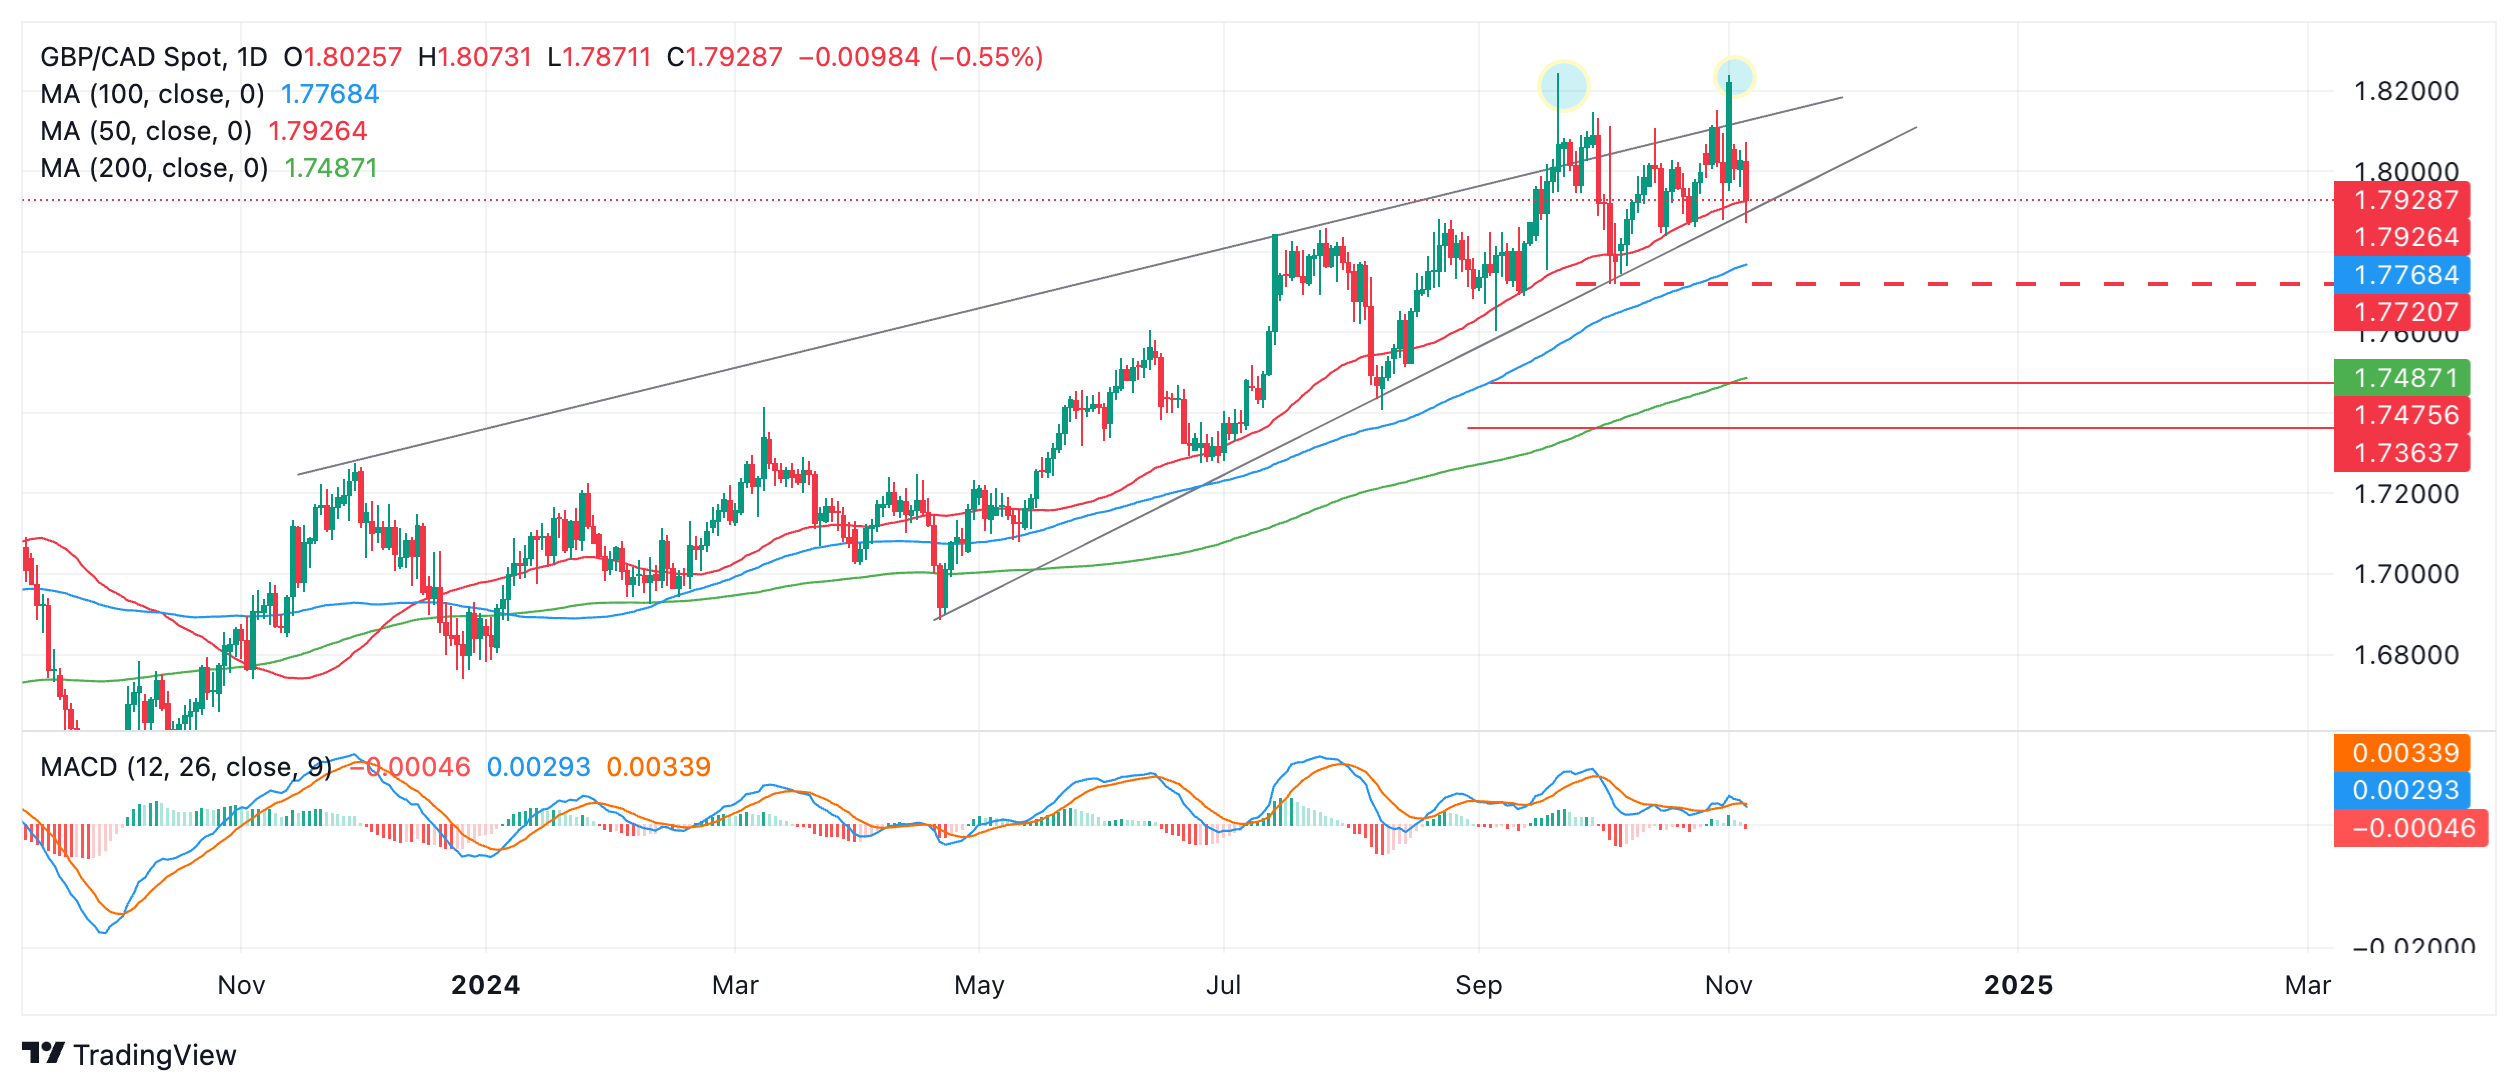
A decisive break below the lower boundary line could see a decline to about the level of the 200-day SMA at around 1.7487. Further bearishness could lead to a move down to a target at 1.7364.

A break below the red dashed line on the chart at the key 1.7719 October 3 swing low would provide more cast-iron confirmation of a breakout and reversal in the medium-term uptrend. 

GBP/CAD broke temporarily above the upper guardrail of the Rising Wedge pattern on several occasions (blue circles on chart) on September 20 and November 1. This could be a sign of bullish exhaustion and an early warning of impending reversal. 

The Moving Average Convergence Divergence (MACD) momentum indicator has been flat recently but looks poised to break lower – a mildly bearish sign on the chart.


Disclaimer: For information purposes only. Past performance is not indicative of future results.
placeholder
Nearly $2 Billion Wiped Out in Crypto Liquidations Amid Brutal Sell-OffThe crypto market experienced nearly $2 billion in liquidations over the past 24 hours, as the total market capitalization dropped below $3 trillion for the first time in five months.Bitcoin (BTC) alo
Author  Beincrypto
5 hours ago
The crypto market experienced nearly $2 billion in liquidations over the past 24 hours, as the total market capitalization dropped below $3 trillion for the first time in five months.Bitcoin (BTC) alo
placeholder
Market Meltdown: BTC, ETH, and XRP Capitulate as Bears Seize ControlBitcoin trades around $85,900 after breaking below $86,000, with Ethereum under $2,791 and XRP below $1.99 as BTC, ETH and XRP extend weekly losses of 8–10%, forcing traders to focus on supports at $85,000, $2,749 and $1.77 for clues on whether this sell-off has further to run.
Author  Mitrade
12 hours ago
Bitcoin trades around $85,900 after breaking below $86,000, with Ethereum under $2,791 and XRP below $1.99 as BTC, ETH and XRP extend weekly losses of 8–10%, forcing traders to focus on supports at $85,000, $2,749 and $1.77 for clues on whether this sell-off has further to run.
placeholder
Bitcoin's Drop to $86K Approaches 'Max Pain' Zone, Yet Presents Potential Buying OpportunityAnalysts identify the $84,000 to $73,000 range as Bitcoin's likely "max pain" territory where capitulation may occur.
Author  Mitrade
12 hours ago
Analysts identify the $84,000 to $73,000 range as Bitcoin's likely "max pain" territory where capitulation may occur.
placeholder
Whale Dump Meets Quantum Panic: Bitcoin Slips to $86,000 and Blows $220 Million LongsBitcoin fell below $87,000 on November 20, 2025, amid a storm of quantum security fears and $1.3 billion whale capitulation. In the process, it blew almost $220 million in long positions out of the wa
Author  Beincrypto
13 hours ago
Bitcoin fell below $87,000 on November 20, 2025, amid a storm of quantum security fears and $1.3 billion whale capitulation. In the process, it blew almost $220 million in long positions out of the wa
placeholder
EUR/USD dives further as traders pare back Fed cuts betsEUR/USD extends losses for the fifth consecutive day and trades at 1.1520 at the time of writing on Thursday after a sharp reversal from levels near 1.1600 on Wednesday.
Author  FXStreet
Yesterday 10: 42
EUR/USD extends losses for the fifth consecutive day and trades at 1.1520 at the time of writing on Thursday after a sharp reversal from levels near 1.1600 on Wednesday.
goTop
quote