

EUR/GBP Price Forecast: Falls back down to floor of range

Source Fxstreet
  • EUR/GBP has sold-off back down to the lows of its short-term range. 
  • It is probably in a sideways trend and is likely to encounter stubborn support at the range lows. 

EUR/GBP declines all the way back down to the base of its six-week range (red dashed line on chart) at roughly 0.8311; it is likely to encounter firm support at the level.

EUR/GBP 4-hour Chart 
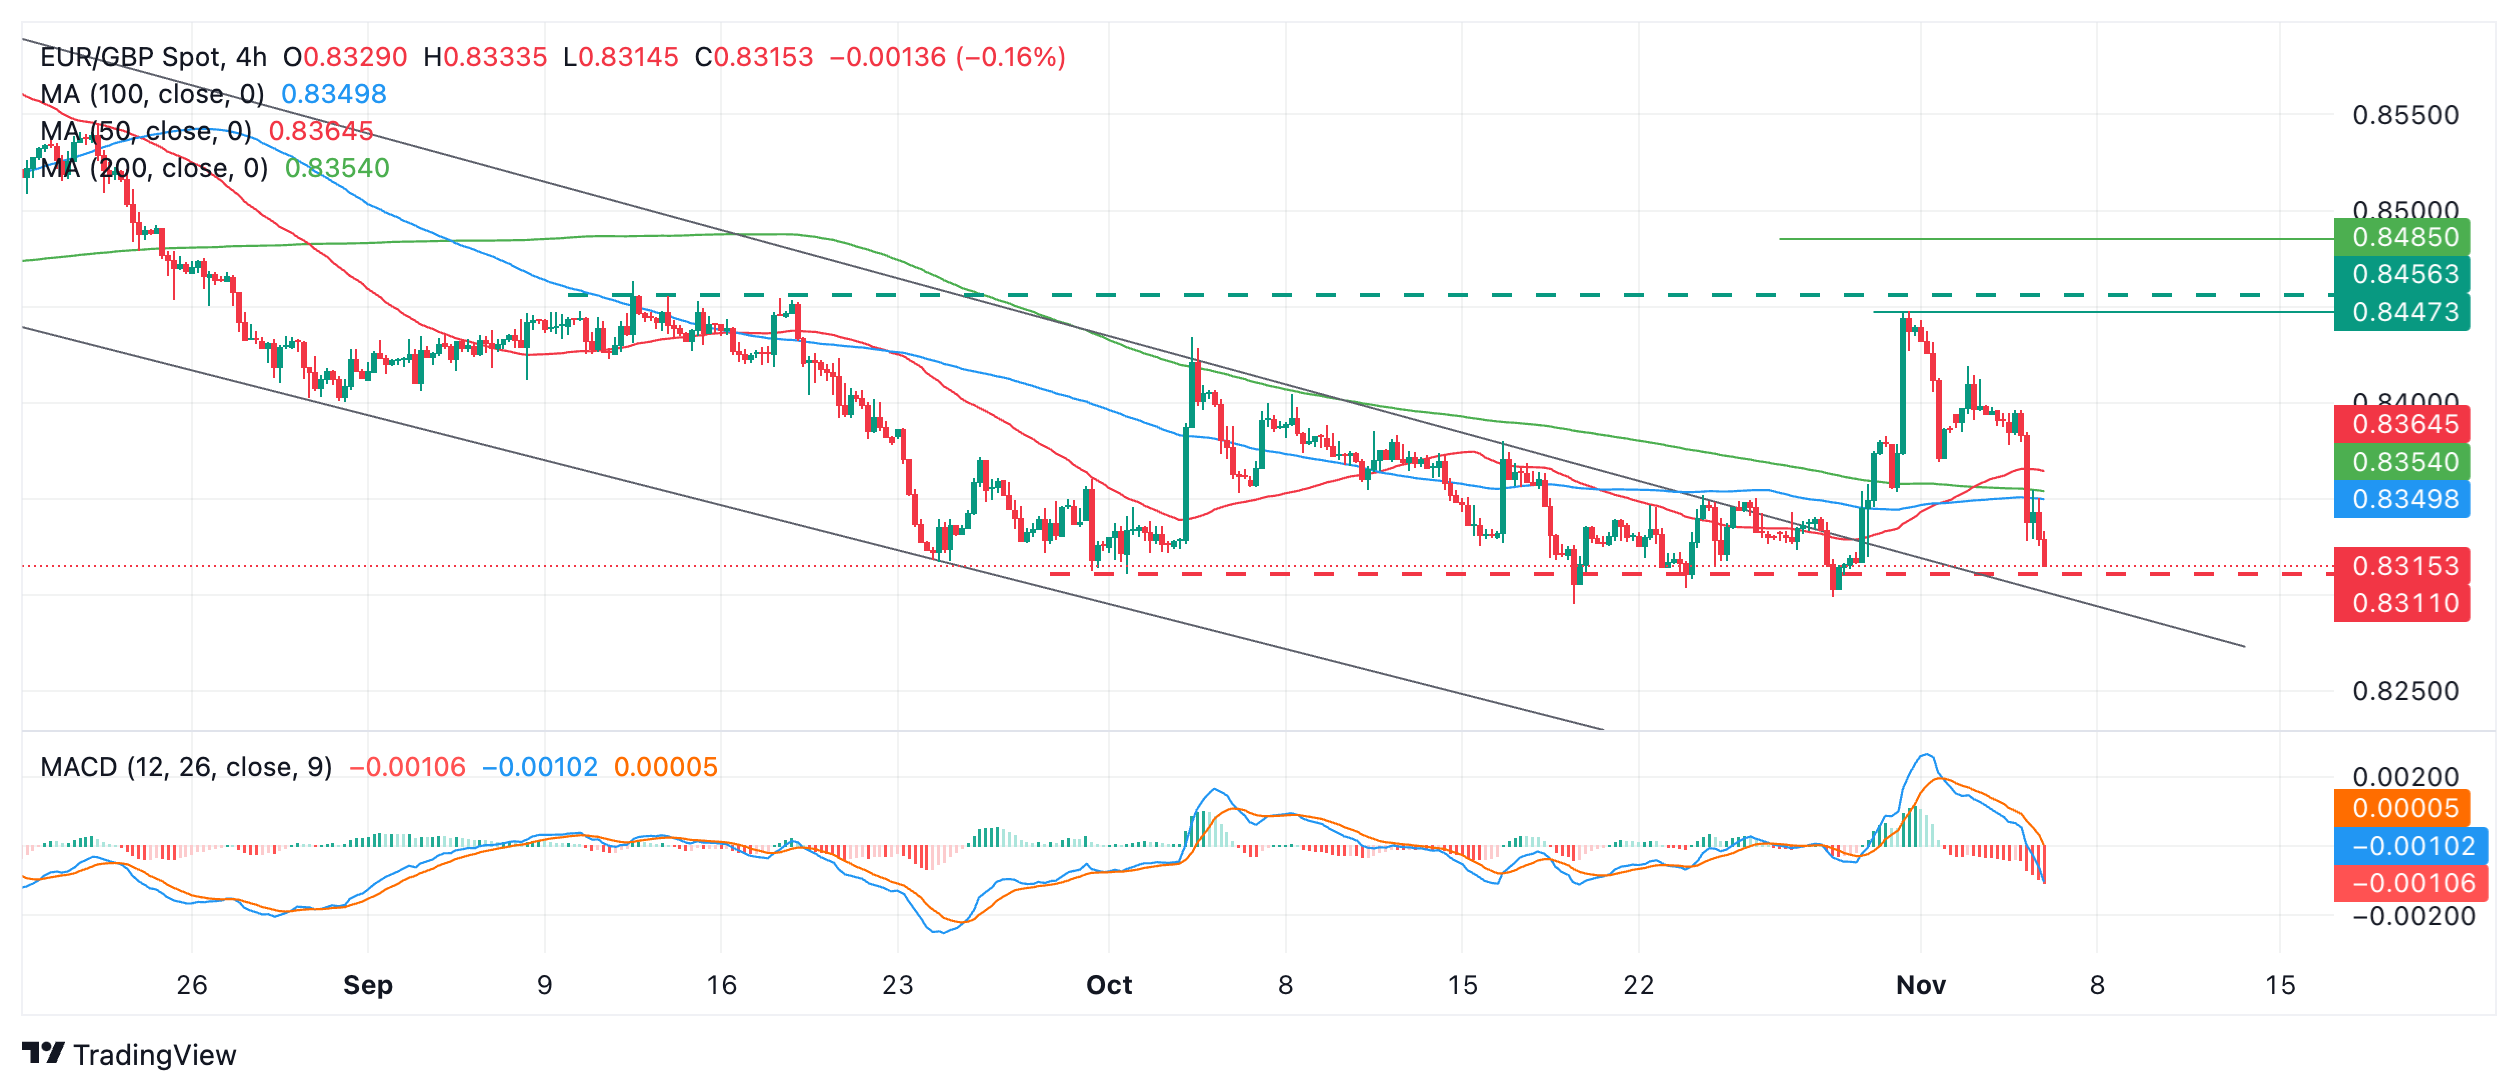
The pair is probably in a short-term sideways trend and given the technical analysis principle that “the trend is your friend” the odds favor an extension of this range-bound price action. 

Therefore, if EUR/GBP stops selling off at the range floor and starts to bounce higher it would confirm that the sideways trend was extending. That said, price has not slowed its descent yet, is still pushing lower and showing no signs of a bounce. 

If the bearish behavior continues and EUR/GBP breaks decisively below the 0.8311 floor, it would suggest the medium and long-term downtrends were reasserting themselves, and the pair was likely to fall further. However, it should be noted these levels represent over two-year lows for the pair.

Nevertheless, a clean break below them, by a longer-than-average daily candlestick below the 0.8311 lows, or perhaps by three consecutive red candles, would confirm a decisive breakdown. Such a move would probably then lead to a sell-off to around the 0.8240 level, this being the 61.8% Fibonacci extension of the height of the range extrapolated lower. 

Disclaimer: For information purposes only. Past performance is not indicative of future results.
placeholder
Gold Price Forecast: XAU/USD struggles to extend recovery above 20-day EMAGold price (XAU/USD) is down 0.8% to near $4,140 during the European trading session on Monday. The precious metal faces selling pressure as the three-day rally hits a pause after failing to extend above $4,202.
Author  FXStreet
13 hours ago
Gold price (XAU/USD) is down 0.8% to near $4,140 during the European trading session on Monday. The precious metal faces selling pressure as the three-day rally hits a pause after failing to extend above $4,202.
placeholder
WTI Crude Oil Price Forecast: OPEC Production Increase Combined With Hormuz Strait Navigation May Drag Prices Down to $60.As of the Asian session on July 6, WTI ( USOIL) crude oil prices extended last Friday's rebound during intraday trading, peaking at $69.26 before consolidating around $68.60. From a techn
Author  TradingKey
13 hours ago
As of the Asian session on July 6, WTI ( USOIL) crude oil prices extended last Friday's rebound during intraday trading, peaking at $69.26 before consolidating around $68.60. From a techn
placeholder
Japanese Yen declines towards 162.00 vs USD as carry trades counter intervention risksThe USD/JPY pair builds on its goodish recovery from the 160.50-160.45 region, or over a two-week low touched on Friday, and gains strong follow-through traction for the second straight day on Monday.
Author  FXStreet
17 hours ago
The USD/JPY pair builds on its goodish recovery from the 160.50-160.45 region, or over a two-week low touched on Friday, and gains strong follow-through traction for the second straight day on Monday.
placeholder
TradingKey Daily Market Briefing: OPEC+ Continues Output Boost, Oil Prices Under Pressure, Gold Rebounds, Bitcoin Stands Above $63,000Tracking Market TrendsTradingKey - On July 6, pre-market Eastern Time, as the US stock market was closed last Friday for the Independence Day holiday, investors turned more to commodities, foreign exc
Author  TradingKey
22 hours ago
Tracking Market TrendsTradingKey - On July 6, pre-market Eastern Time, as the US stock market was closed last Friday for the Independence Day holiday, investors turned more to commodities, foreign exc
placeholder
Gold Price Forecast: US Non-Farm Payrolls Miss Expectations, Gold Surges Over $100, Can the Bull Run Continue?As of the Asian session on July 3, gold prices ( XAUUSD) extended yesterday's rally, climbing to an intraday high of $4,195.52. Looking at the charts, gold has gained over $100 in total s
Author  TradingKey
Jul 03, Fri
As of the Asian session on July 3, gold prices ( XAUUSD) extended yesterday's rally, climbing to an intraday high of $4,195.52. Looking at the charts, gold has gained over $100 in total s
Related Instrument
goTop
quote