EUR/GBP Price Analysis: Aiming higher with bulls recovering but with more work to do

Source Fxstreet
  • The EUR/GBP currency pair continues to trade sideways between the 20 and 100-day SMA .
  •  RSI indicates recovering buying pressure and the MACD is green.
  • Sellers breathe, after last Friday’s sharp losses.

In Monday's session, the EUR/GBP pair rose by 0.20% to 0.8395. While the pair remains in a sideways trend, the bullish pressure has shown signs of softening in the last sessions. For the short term, there are signs of a side-ways trade period after last Friday;s 0.60% losses.

The Relative Strength Index (RSI) is currently at 55, indicating that buying pressure is gradually increasing. However, the RSI has recently declined sharply, suggesting that buying pressure is easing. The Moving Average Convergence Divergence (MACD) histogram is flat and green, indicating that buying pressure is steady.

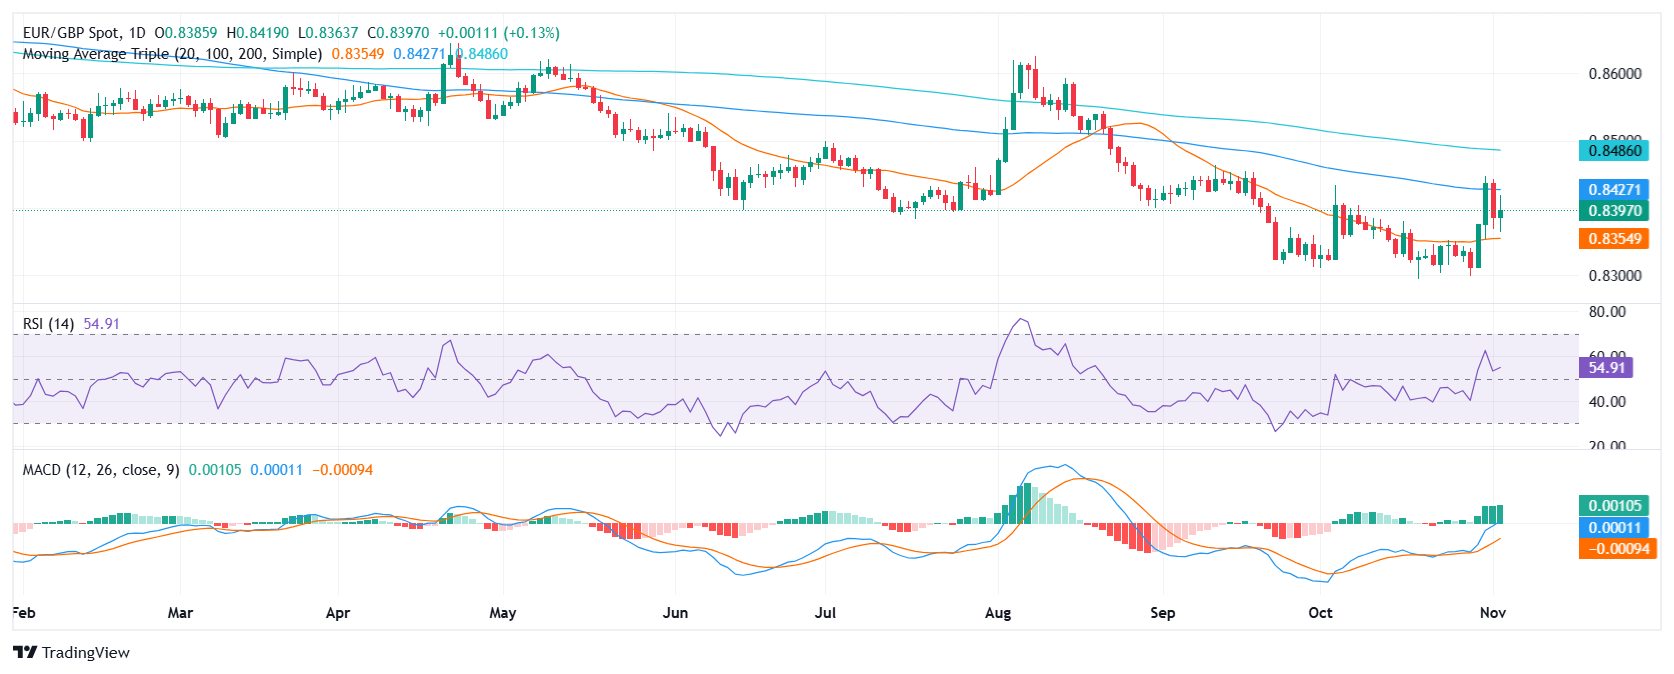
The overall technical outlook for the EUR/GBP is neutral to slightly bullish. The pair is likely to continue trading within the 0.8350-0.8450 (20 and 100-day Simple Moving Averages) range in the near term. However, the recent softening of the bullish trend suggests that the pair may be due for a correction lower which could be triggered if the bulls fail to defend the 20-day SMA.

EUR/GBP daily chart


Disclaimer: For information purposes only. Past performance is not indicative of future results.
placeholder
Nearly $2 Billion Wiped Out in Crypto Liquidations Amid Brutal Sell-OffThe crypto market experienced nearly $2 billion in liquidations over the past 24 hours, as the total market capitalization dropped below $3 trillion for the first time in five months.Bitcoin (BTC) alo
Author  Beincrypto
Yesterday 10: 24
The crypto market experienced nearly $2 billion in liquidations over the past 24 hours, as the total market capitalization dropped below $3 trillion for the first time in five months.Bitcoin (BTC) alo
placeholder
Market Meltdown: BTC, ETH, and XRP Capitulate as Bears Seize ControlBitcoin trades around $85,900 after breaking below $86,000, with Ethereum under $2,791 and XRP below $1.99 as BTC, ETH and XRP extend weekly losses of 8–10%, forcing traders to focus on supports at $85,000, $2,749 and $1.77 for clues on whether this sell-off has further to run.
Author  Mitrade
Yesterday 04: 15
Bitcoin trades around $85,900 after breaking below $86,000, with Ethereum under $2,791 and XRP below $1.99 as BTC, ETH and XRP extend weekly losses of 8–10%, forcing traders to focus on supports at $85,000, $2,749 and $1.77 for clues on whether this sell-off has further to run.
placeholder
Bitcoin's Drop to $86K Approaches 'Max Pain' Zone, Yet Presents Potential Buying OpportunityAnalysts identify the $84,000 to $73,000 range as Bitcoin's likely "max pain" territory where capitulation may occur.
Author  Mitrade
Yesterday 03: 35
Analysts identify the $84,000 to $73,000 range as Bitcoin's likely "max pain" territory where capitulation may occur.
placeholder
Whale Dump Meets Quantum Panic: Bitcoin Slips to $86,000 and Blows $220 Million LongsBitcoin fell below $87,000 on November 20, 2025, amid a storm of quantum security fears and $1.3 billion whale capitulation. In the process, it blew almost $220 million in long positions out of the wa
Author  Beincrypto
Yesterday 03: 11
Bitcoin fell below $87,000 on November 20, 2025, amid a storm of quantum security fears and $1.3 billion whale capitulation. In the process, it blew almost $220 million in long positions out of the wa
placeholder
EUR/USD dives further as traders pare back Fed cuts betsEUR/USD extends losses for the fifth consecutive day and trades at 1.1520 at the time of writing on Thursday after a sharp reversal from levels near 1.1600 on Wednesday.
Author  FXStreet
Nov 20, Thu
EUR/USD extends losses for the fifth consecutive day and trades at 1.1520 at the time of writing on Thursday after a sharp reversal from levels near 1.1600 on Wednesday.
goTop
quote