

EUR/JPY Price Prediction: Pulls back to trendline of advance
Source Fxstreet
- EUR/JPY corrects back to the trendline for its bullish advance.
- Given the short and medium-term trends are bullish, the odds favor more upside if certain conditions are met.
EUR/JPY is pulling back within its short and medium-term uptrend. The pair has fallen to the level of the trendline (dashed line) for the rally since the September lows. Given the trend is bullish and technical analysis theory says “the trend is your friend” the odds favor more upside once the correction completes.
EUR/JPY Daily Chart
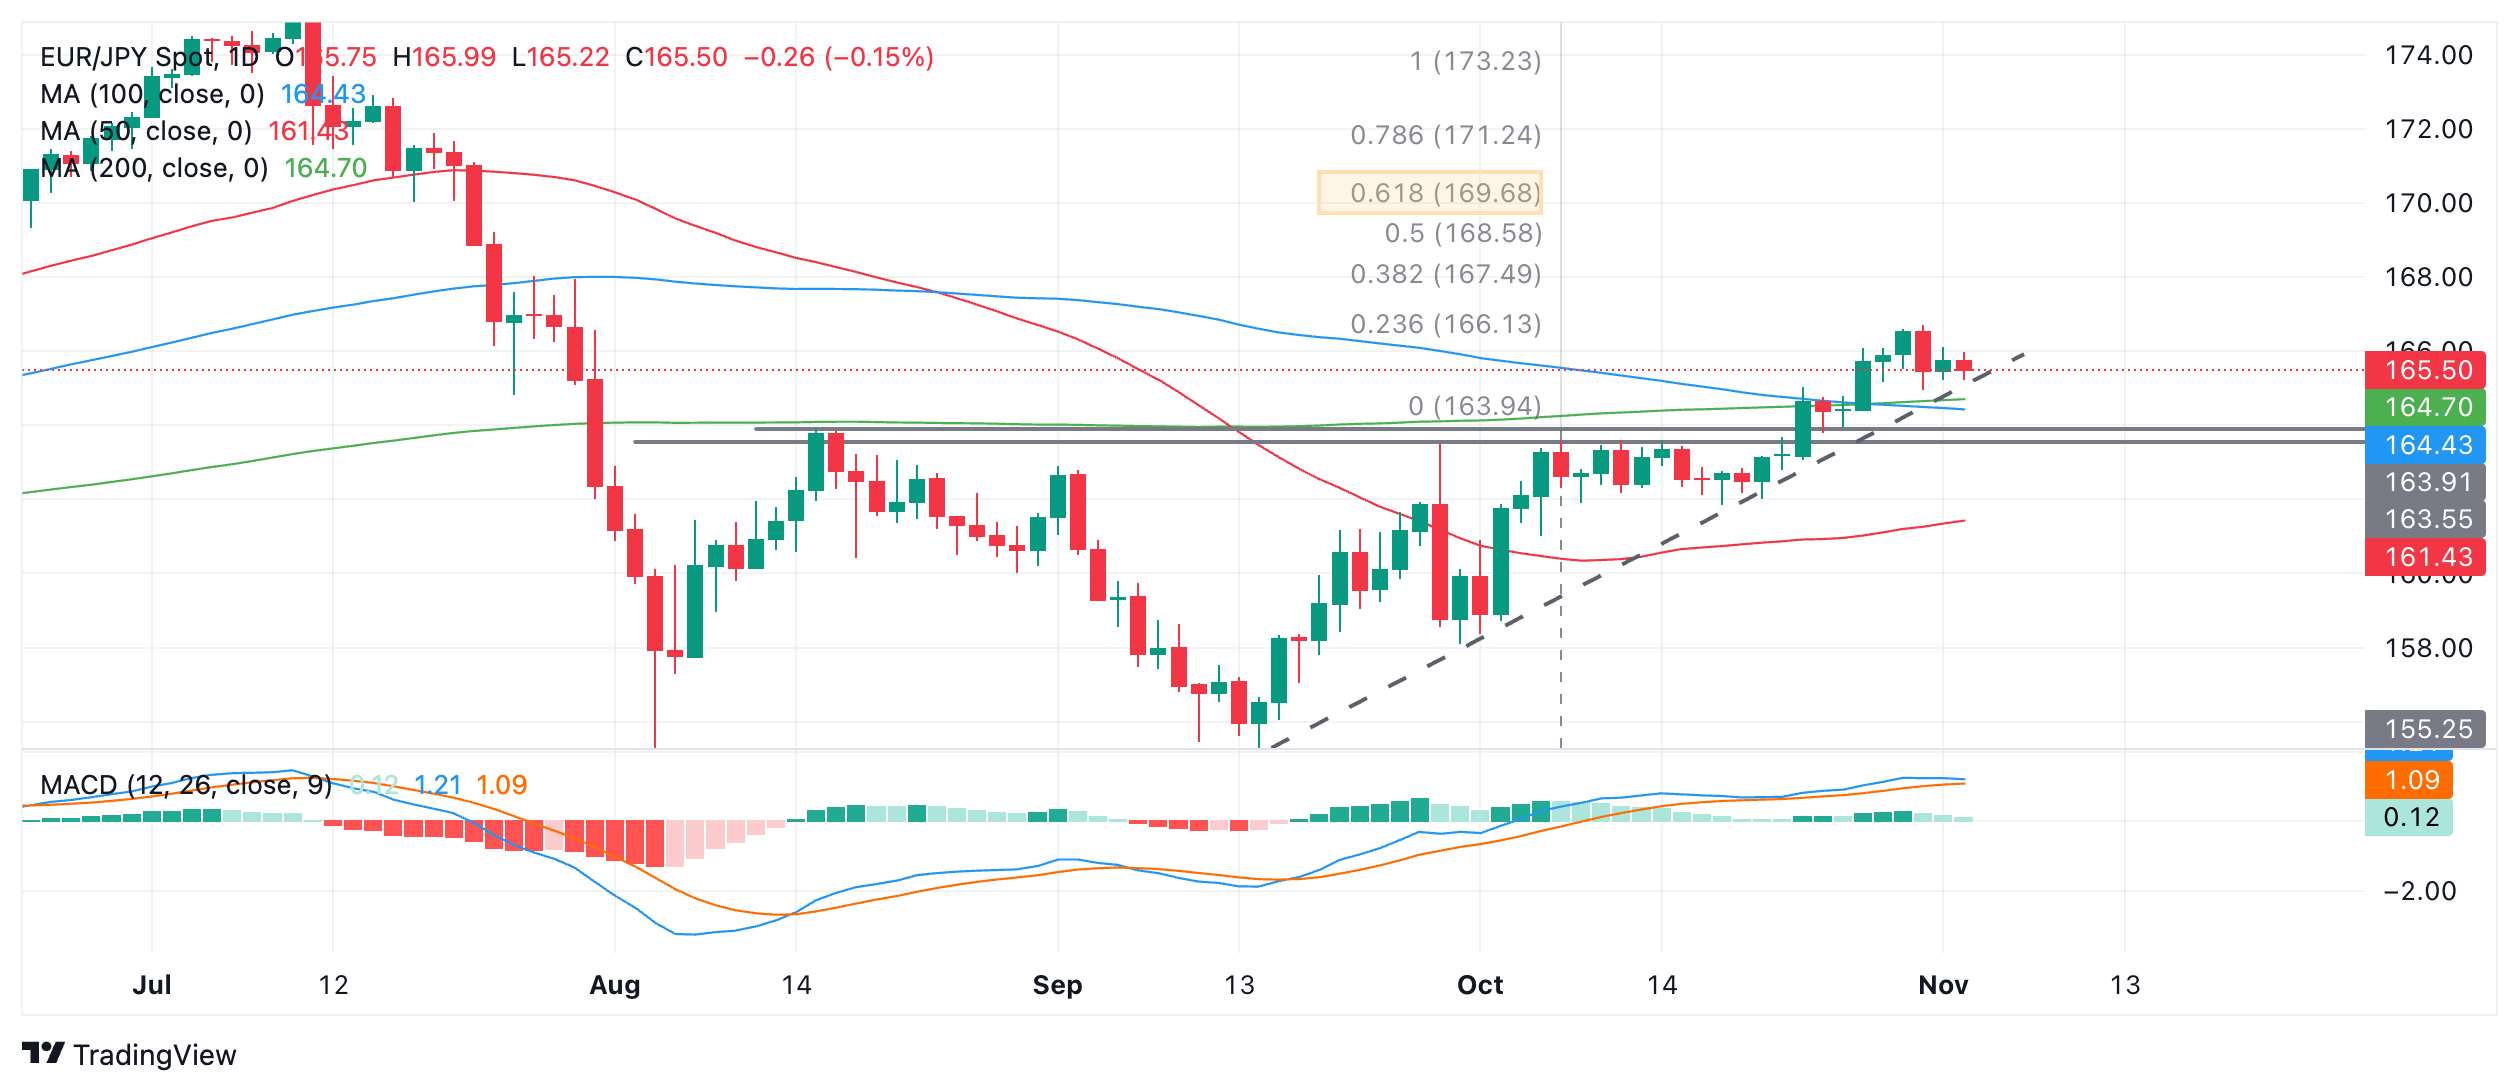
A break above 166.69 (October 31 high) would probably confirm a continuation higher.
Resistance at 167.96 (July 30 swing high) could act as a barrier to further upside. The minimum target for the breakout from the range lies at 169.68, the 61.8% Fibonacci extrapolation of the height of the range to the upside (orange-shaded rectangle).
Disclaimer: For information purposes only. Past performance is not indicative of future results.
Recommended Articles

Natural Gas sinks to pivotal level as China’s demand slumpsNatural Gas price (XNG/USD) edges lower and sinks to $2.56 on Monday, extending its losing streak for the fifth day in a row. The move comes on the back of China cutting its Liquified Natural Gas (LNG) imports after prices rose above $3.0 in June. It
Natural Gas price (XNG/USD) edges lower and sinks to $2.56 on Monday, extending its losing streak for the fifth day in a row. The move comes on the back of China cutting its Liquified Natural Gas (LNG) imports after prices rose above $3.0 in June. It
Leading decentralized finance (DeFi) platform Aave has reached a significant milestone, hitting $35 billion in total net deposits. This marks Aave’s new all-time high (ATH) in net deposits since
After a turbulent 2025, what lies ahead for commodities, forex, and cryptocurrency markets in 2026?
My Top 5 Stock Market Predictions for 2026Five 2026 market predictions written in a native, news-style voice: AI’s winners and losers, broader sector leadership, dividend demand, valuation cooling as the Shiller CAPE sits at 39 (Dec. 31, 2025), and quantum-computing bursts—while keeping all original facts and numbers unchanged.
Five 2026 market predictions written in a native, news-style voice: AI’s winners and losers, broader sector leadership, dividend demand, valuation cooling as the Shiller CAPE sits at 39 (Dec. 31, 2025), and quantum-computing bursts—while keeping all original facts and numbers unchanged.
As of the Asian session on July 30, gold prices ( XAUUSD) surged and then retraced following the Federal Reserve meeting, once falling to $4,028.62 during the session. From a market persp
Related Instrument


