

NZD/USD Price Analysis: Gives up majority of intraday gains
- NZD/USD fails to hold the Asian session’s strength amid persistent weakness in the Kiwi dollar.
- The NZ Unemployment Rate is expected to have risen to 5% in the third quarter of this year.
- This week, investors await the US presidential elections and the Fed’s policy decision.
The NZD/USD pair falls back sharply to near 0.5980 in European trading hours on Monday after a strong opening. The Kiwi pair retreats on persistent weakness in the New Zealand Dollar (NZD) due to expectations that the Reserve Bank of New Zealand (RBNZ) will cut its Official Cast Rate (OCR) again by 50 basis points (bps) on November 27.
On the economic front, investors await the Q3 Employment data, which will be published on Wednesday. Economists expect the Unemployment Rate to have increased to 5.0% from 4.6% in the previous sector. In the same period, the NZ laborforce is estimated to have declined by 0.4%, the similar pace at which it grew in the previous quarter. The Labor Cost Index is expected to have grown by 3.4% year-on-year, slower than 3.6% in the second quarter of this year. Weakening labor market conditions would prompt RBNZ dovish bets.
Meanwhile, the US Dollar (US) remains under pressure as traders brace for the United States (US) presidential elections on Tuesday and the Federal Reserve’s (Fed) policy meeting on Thursday. According to various national polls, there would be fierce competition between Republican candidate Donald Trump and current Vice President Kamala Harris.
On the monetary policy front, investors expect the Fed to cut interest rates again. However, the rate cut size is expected to be 25 bps against 50 bps opted by the Fed in Septeber.
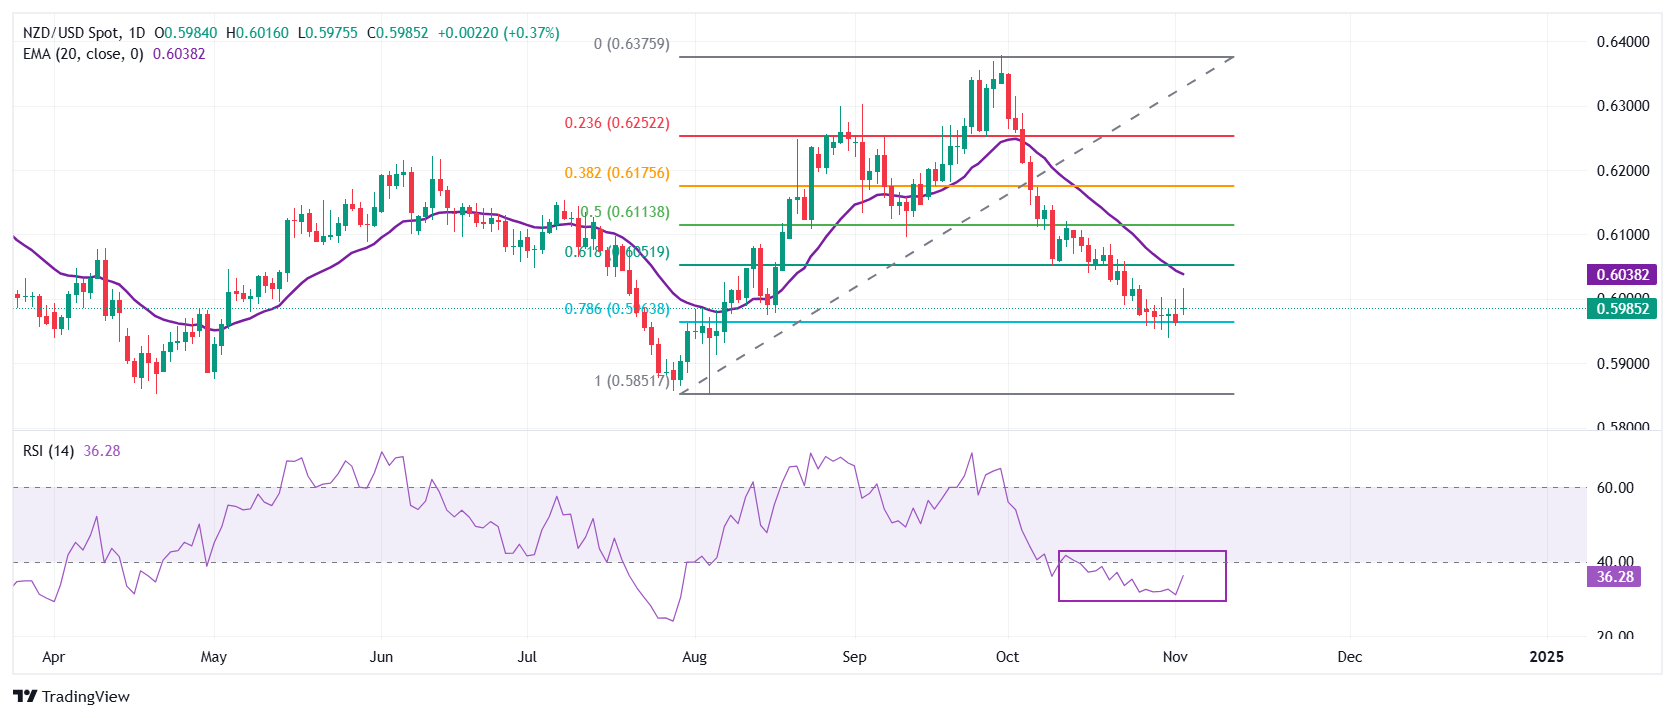
NZD/USD remains well-supported above the 78.6% Fibonacci retracement around 0.5960. The Fibo tool is plotted from the August 5 low at 0.5850 to the September 30 high at 0.6380.
Downward-sloping 20-day Exponential Moving Average (EMA) near 0.6030, suggests that the near-term trend is bearish.
The 14-day Relative Strength Index (RSI) oscillates below 40.00, indicating that a strong bearish momentum is intact.
More downside is highly likely towards the round-level support of 0.5900 and the August 5 low at 0.5850 if the pair decisively breaks below the October 31 low of 0.5940.
On the flip side, a reversal move above 61.8% Fibo retracement near 0.6050 will drive the asset toward the round-level resistance of 0.6100 and the October 8 high of 0.6146.
NZD/USD daily chart
New Zealand Dollar FAQs
The New Zealand Dollar (NZD), also known as the Kiwi, is a well-known traded currency among investors. Its value is broadly determined by the health of the New Zealand economy and the country’s central bank policy. Still, there are some unique particularities that also can make NZD move. The performance of the Chinese economy tends to move the Kiwi because China is New Zealand’s biggest trading partner. Bad news for the Chinese economy likely means less New Zealand exports to the country, hitting the economy and thus its currency. Another factor moving NZD is dairy prices as the dairy industry is New Zealand’s main export. High dairy prices boost export income, contributing positively to the economy and thus to the NZD.
The Reserve Bank of New Zealand (RBNZ) aims to achieve and maintain an inflation rate between 1% and 3% over the medium term, with a focus to keep it near the 2% mid-point. To this end, the bank sets an appropriate level of interest rates. When inflation is too high, the RBNZ will increase interest rates to cool the economy, but the move will also make bond yields higher, increasing investors’ appeal to invest in the country and thus boosting NZD. On the contrary, lower interest rates tend to weaken NZD. The so-called rate differential, or how rates in New Zealand are or are expected to be compared to the ones set by the US Federal Reserve, can also play a key role in moving the NZD/USD pair.
Macroeconomic data releases in New Zealand are key to assess the state of the economy and can impact the New Zealand Dollar’s (NZD) valuation. A strong economy, based on high economic growth, low unemployment and high confidence is good for NZD. High economic growth attracts foreign investment and may encourage the Reserve Bank of New Zealand to increase interest rates, if this economic strength comes together with elevated inflation. Conversely, if economic data is weak, NZD is likely to depreciate.
The New Zealand Dollar (NZD) tends to strengthen during risk-on periods, or when investors perceive that broader market risks are low and are optimistic about growth. This tends to lead to a more favorable outlook for commodities and so-called ‘commodity currencies’ such as the Kiwi. Conversely, NZD tends to weaken at times of market turbulence or economic uncertainty as investors tend to sell higher-risk assets and flee to the more-stable safe havens.
Recommended Articles


