EUR/JPY Price Prediction: Meeting brick wall of resistance at range ceiling

Source Fxstreet
  • EUR/JPY continues trying but failing to breakout above the top of a range. 
  • MACD is diverging bearishly with price and there is a strong possibility of decline unfolding. 

EUR/JPY is meeting a brick wall of resistance at the top of its ten-week range and despite repeated attempts has not been able to breakout higher. 

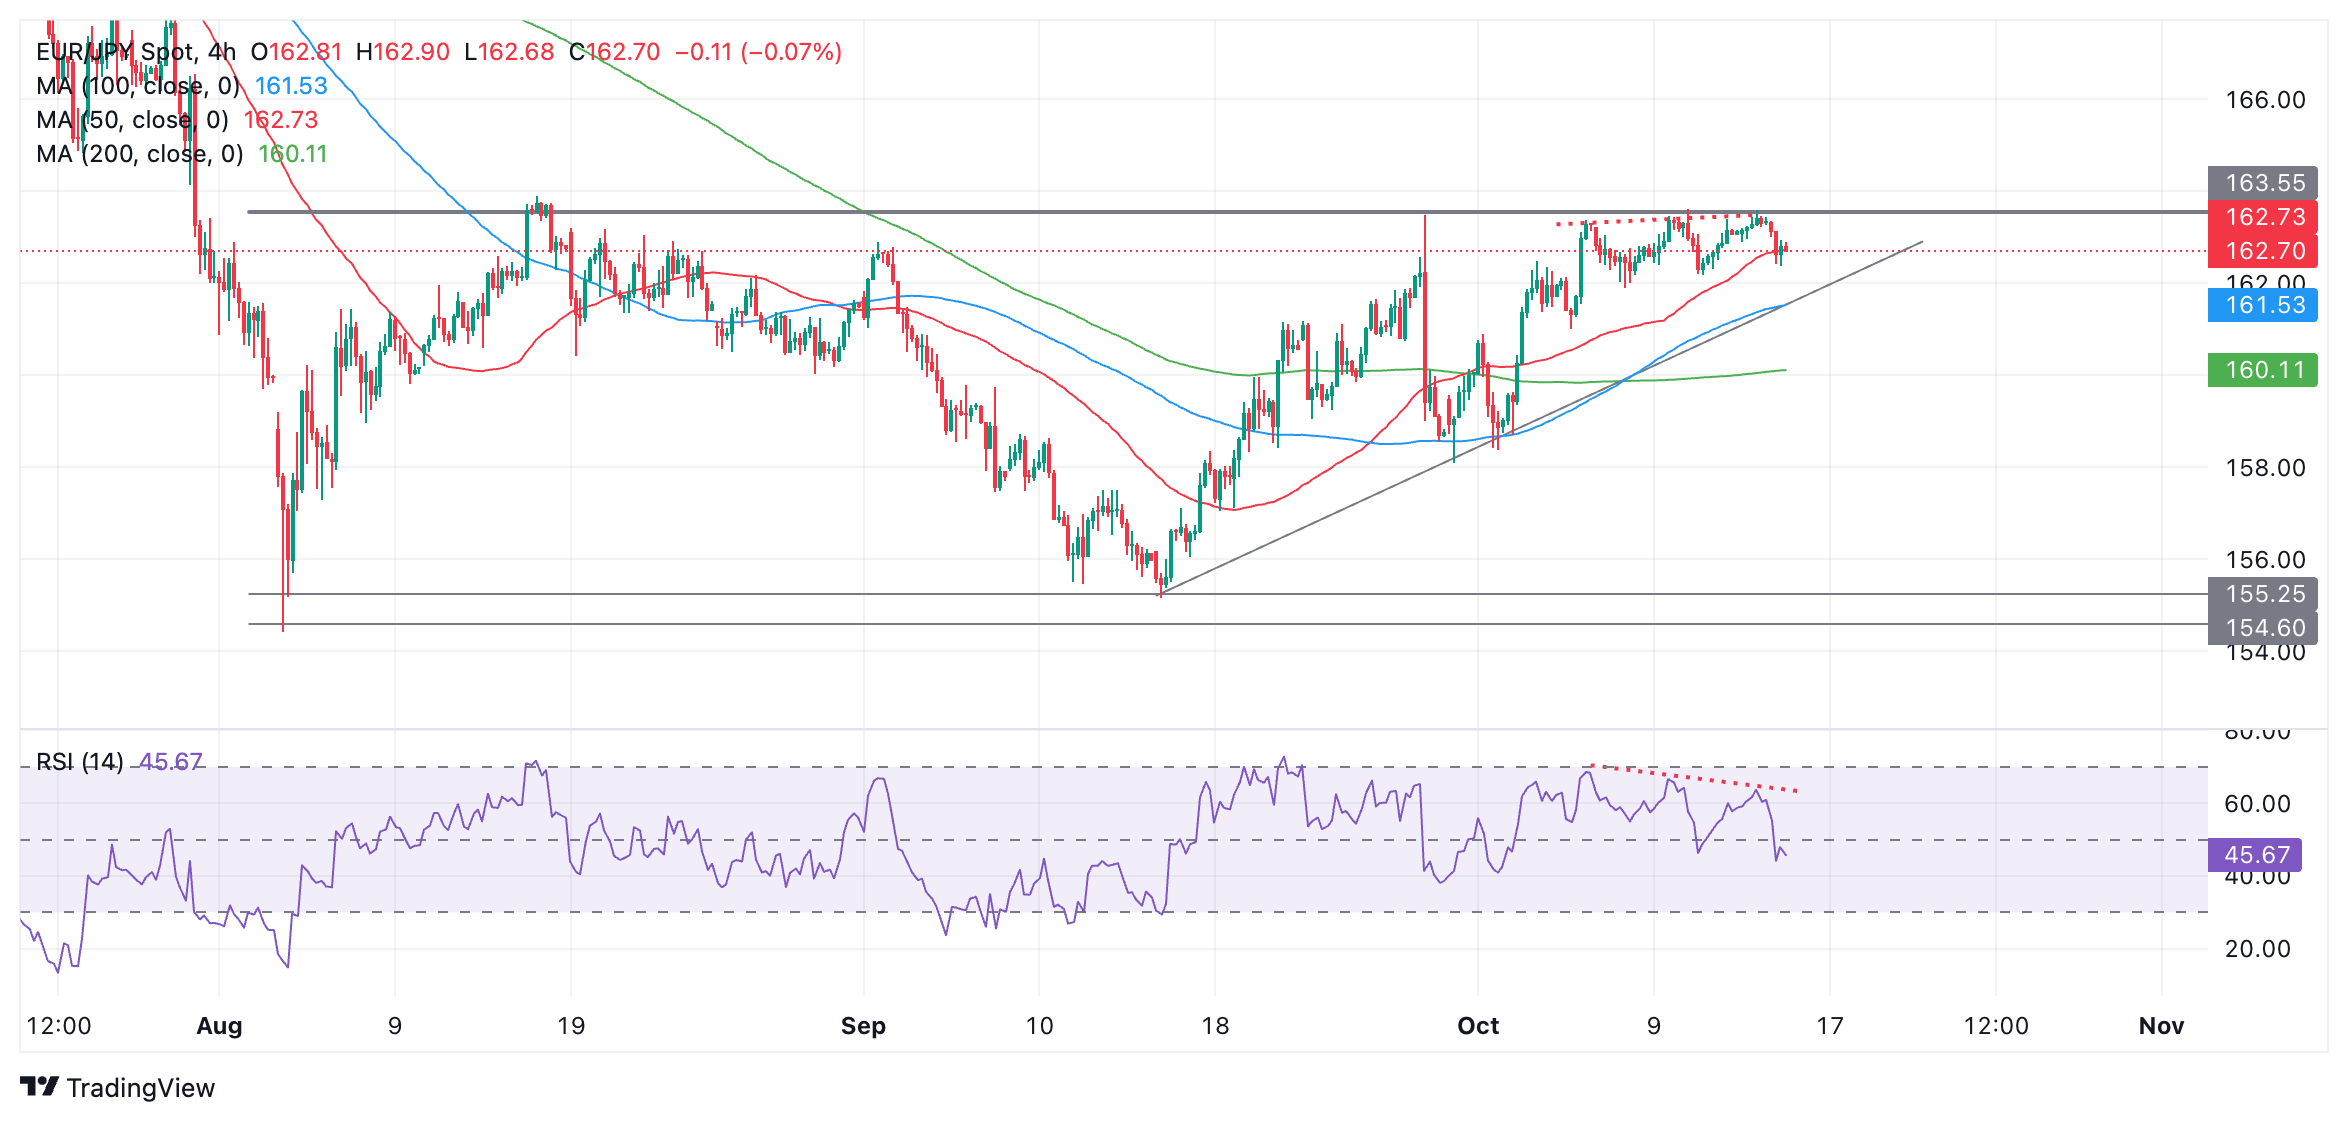
EUR/JPY 4-hour Chart 

The pair is in an overall range-bound market – its trend is sideways. Since it is a principle of technical analysis that trends tend to extend, the odds favor a continuation of the range. 

This suggests that the next move for EUR/JPY will be back down towards the range floor in the 154s. 

A move below 161.91 (October 8 low) would help confirm such a move was underway. A break below the trendline for the up leg at around 161.70 (black line on chart) would provide stronger confirmation. The next downside target for EUR/JPY would be at about 158.32 – the October 1 as well as September 30 lows. 

The Moving Average Convergence Divergence (MACD) momentum indicator is diverging bearishly with price (red dotted lines on chart). Whilst price has been making slightly higher highs with each breakout attempt, MACD has been declining. This is a further warning sign of losses to come.

Alternatively, it is possible that a decisive break above the range highs would indicate a breakout higher and the evolution of a new short-term uptrend. A decisive move would be one characterized by a longer-than-average green candlestick which cleared the range high and closed near its high, or three green candles in a row breaking above the top of the range. 


Disclaimer: For information purposes only. Past performance is not indicative of future results.
placeholder
Markets in 2026: Will gold, Bitcoin, and the U.S. dollar make history again? — These are how leading institutions thinkAfter a turbulent 2025, what lies ahead for commodities, forex, and cryptocurrency markets in 2026?
Author  Insights
Dec 25, 2025
After a turbulent 2025, what lies ahead for commodities, forex, and cryptocurrency markets in 2026?
placeholder
ECB Policy Outlook for 2026: What It Could Mean for the Euro’s Next MoveWith the ECB likely holding rates steady at 2.15% and the Fed potentially extending cuts into 2026, EUR/USD may test 1.20 if Eurozone growth proves resilient, but weaker growth and an ECB pivot could pull the pair back toward 1.13 and potentially 1.10.
Author  Mitrade
Dec 26, 2025
With the ECB likely holding rates steady at 2.15% and the Fed potentially extending cuts into 2026, EUR/USD may test 1.20 if Eurozone growth proves resilient, but weaker growth and an ECB pivot could pull the pair back toward 1.13 and potentially 1.10.
placeholder
WTI falls below $93.50 on hopes of strait of Hormuz reopeningWest Texas Intermediate (WTI), the US crude oil benchmark, is trading around $93.25 during the early Asian trading hours on Thursday. The WTI price declines on optimism over a possible deal to end the war with Iran. 
Author  FXStreet
Yesterday 01: 21
West Texas Intermediate (WTI), the US crude oil benchmark, is trading around $93.25 during the early Asian trading hours on Thursday. The WTI price declines on optimism over a possible deal to end the war with Iran. 
placeholder
Bitcoin jumps to three-month high as US–Iran talks unwind oil risk premiumGlobal markets moved sharply on Wednesday as signs of progress in US–Iran negotiations triggered a rapid unwind of war-driven positions, dragging oil prices lower while lifting equities and cryptocurrencies. Bitcoin climbed above $81,000, its highest level in three months, while Brent crude fell roughly 11% to around $98 per barrel. The S&P 500 rose 0.85%...
Author  Cryptopolitan
20 hours ago
Global markets moved sharply on Wednesday as signs of progress in US–Iran negotiations triggered a rapid unwind of war-driven positions, dragging oil prices lower while lifting equities and cryptocurrencies. Bitcoin climbed above $81,000, its highest level in three months, while Brent crude fell roughly 11% to around $98 per barrel. The S&P 500 rose 0.85%...
placeholder
WTI falls to near $93.50 after Israel, Iran signal an end to hostilitiesWest Texas Intermediate (WTI) oil price loses ground after registering modest gains in the previous day, trading around $93.70 per barrel during the Asian hours on Friday.
Author  FXStreet
2 hours ago
West Texas Intermediate (WTI) oil price loses ground after registering modest gains in the previous day, trading around $93.70 per barrel during the Asian hours on Friday.
Related Instrument
goTop
quote