NZD/JPY Price Analysis: Bullish outlook prevails, resistance test ahead

Source Fxstreet
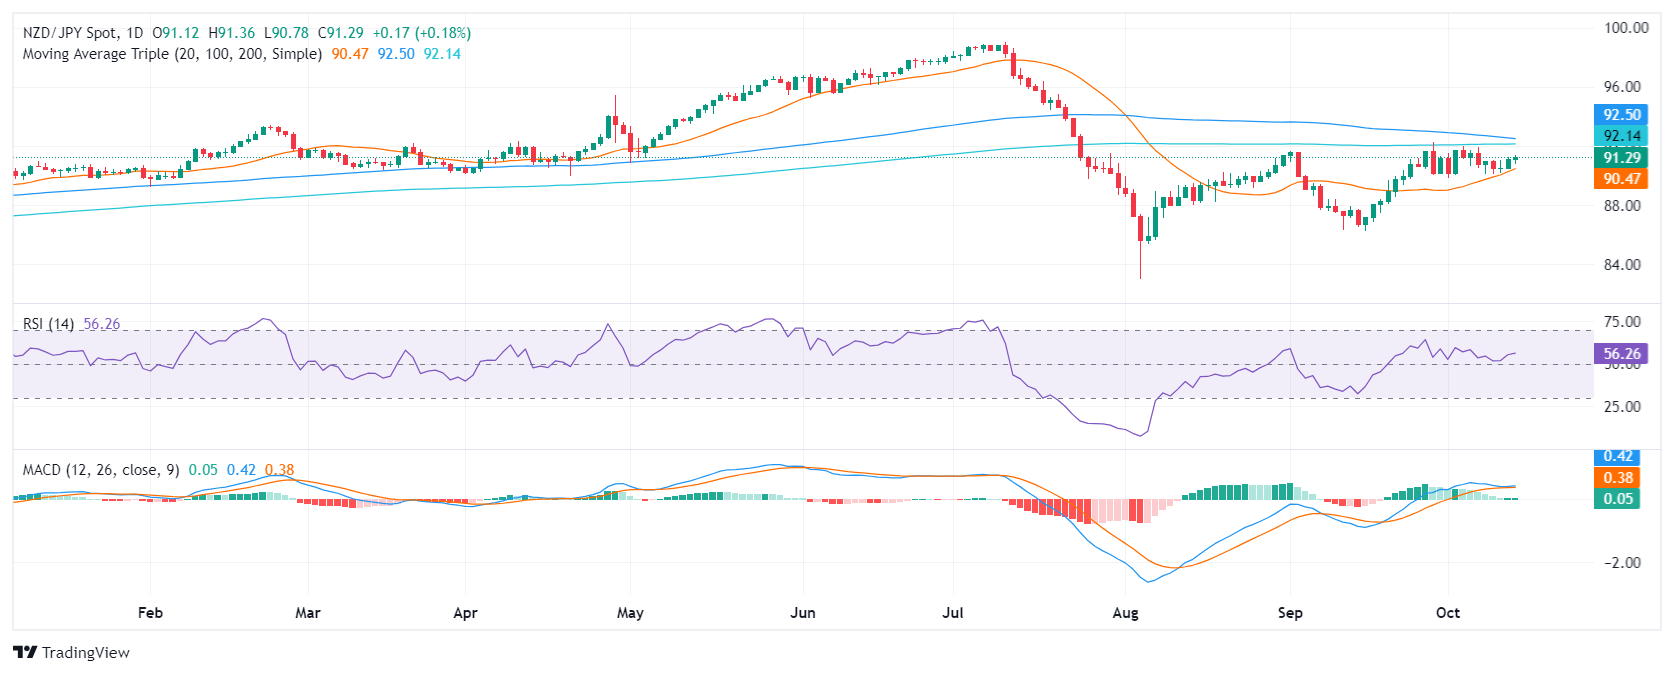
  • NZD/JPY has been trading sideways recently, with a slightly bullish outlook.
  • RSI is in the positive area and rising, MACD is flat and green.
  • A breakout above 92.50 could confirm further upside potential.

The NZD/JPY pair resumed its upward trajectory on Monday, gaining 0.15% to 91.25. Since early October, the pair has been trading in a narrow range, consolidating the gains from last month but the 20,100 and 200-day Simple Moving Averages (SMAs) seem to be converging towards the 92.50 which could signal that a test of that level may be on the horizon.

The Relative Strength Index (RSI) is in the positive area and rising, indicating that buying pressure is strong. The Moving Average Convergence Divergence (MACD) is flat and green, suggesting that buying pressure is steady.

The price action has been contained within a narrow range, and the pair has not made any significant upward or downward spikes. The technical outlook remains bullish, and a breakout above 92.50 could confirm further upside potential. Supports are seen at 90.00, 90.50, and 91.00, and resistances at 91.50, 92.00 (20,100 and 200-day SMA convergence), and 92.50.

NZD/JPY daily chart


Disclaimer: For information purposes only. Past performance is not indicative of future results.
placeholder
The Ultimate Test for the Market: What Nvidia's Earnings Mean for U.S. StocksTradingKey - Nvidia (NVDA), the leader in the AI chip market, is set to release its fiscal year 2026 Q3 earnings report after the close of US markets on Wednesday. As US investors engage in a frantic
Author  TradingKey
12 hours ago
TradingKey - Nvidia (NVDA), the leader in the AI chip market, is set to release its fiscal year 2026 Q3 earnings report after the close of US markets on Wednesday. As US investors engage in a frantic
placeholder
Top 3 Price Prediction: Bitcoin, Ethereum, Ripple – BTC, ETH and XRP Look for a Foothold After a Sharp ShakeoutBitcoin trades near $92,600 after a dip below $90,000, while Ethereum around $3,118 and XRP near $2.21–$2.23 sit on key support zones, as BTC, ETH and XRP all try to turn a sharp correction into a tradable rebound rather than a deeper slide.
Author  Mitrade
16 hours ago
Bitcoin trades near $92,600 after a dip below $90,000, while Ethereum around $3,118 and XRP near $2.21–$2.23 sit on key support zones, as BTC, ETH and XRP all try to turn a sharp correction into a tradable rebound rather than a deeper slide.
placeholder
Bitcoin Falls Below $90K: BitMine & Bitwise Executives Predict Market Bottom This Week​Bitcoin's recent drop below $90,000 may signal a market bottom, according to industry leaders.
Author  Mitrade
17 hours ago
​Bitcoin's recent drop below $90,000 may signal a market bottom, according to industry leaders.
placeholder
Australian Dollar holds losses following Q3 Wage Price Index dataThe Australian Dollar (AUD) declines against the US Dollar (USD) on Wednesday after registering more than 0.25% gains in the previous session. The AUD/USD pair remains subdued after the release of medium-impact Wage Price Index data for the third quarter.
Author  FXStreet
21 hours ago
The Australian Dollar (AUD) declines against the US Dollar (USD) on Wednesday after registering more than 0.25% gains in the previous session. The AUD/USD pair remains subdued after the release of medium-impact Wage Price Index data for the third quarter.
placeholder
U.S. September Nonfarm Payrolls: Two-Scenario Analysis, Will U.S. Stocks Diverge in Short-Term and Medium-to-Long-Term Trends?1. IntroductionAffected by the U.S. government shutdown, the September nonfarm payrolls report—originally scheduled for release in early October—will be officially published on 20 November. As a key "
Author  TradingKey
Yesterday 10: 18
1. IntroductionAffected by the U.S. government shutdown, the September nonfarm payrolls report—originally scheduled for release in early October—will be officially published on 20 November. As a key "
goTop
quote