

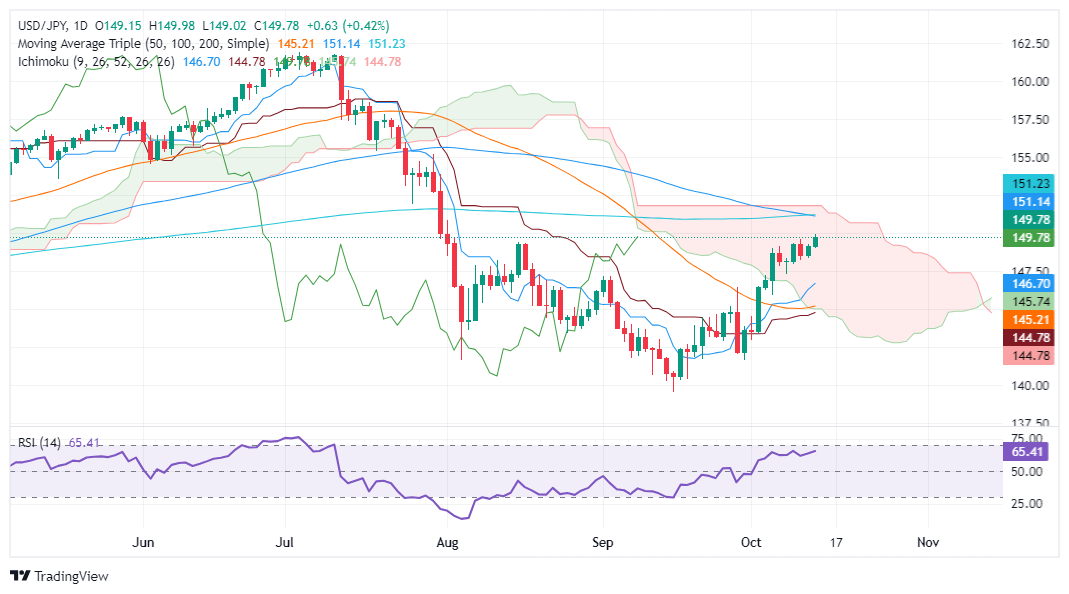
USD/JPY Price Forecast: Hits two-month peak near 150.00
- USD/JPY reaches a two-month high of 149.98 but faces resistance at the psychological 150.00 figure.
- Technical outlook remains upward biased, with bullish RSI signaling room for further gains before overbought conditions.
- A break above 150.00 could target resistance at the 100 and 200-day DMAs around 151.14-151.22, while a drop below 149.50 could prompt a retest of 149.00 and the October 8 low at 147.35.
The USD/JPY extended its gains throughout the North American session, up 0.42%, and trading at 149.75 at the time of writing. The pair hit a two-month high of 149.98, though buyers lacked the force to crack the 150.00 figure.
USD/JPY Price Forecast: Technical outlook
The USD/JPY daily chart is neutral to upward biased after clearing key support levels.
Momentum, as measured by the Relative Strength Index (RSI), is bullish, with enough room to spare before turning overbought.
If USD/JPY clears the 150.00 figure, this could pave the way for challenging the 100 and 200-day moving averages (DMAs) each at 151.14 and 151.22. On further strength, the next stop would be the top of the Ichimoku Cloud (Kumo) at 152.00.
Conversely, if USD/JPY falls beneath the 149.50 mark, this could sponsor a test of the 149.00 mark. A breach of the latter will expose the October 8 low of 147.35, ahead of the Tenkan-Sen at 146.70.
USD/JPY Price Action – Daily Chart
Japanese Yen PRICE Today
The table below shows the percentage change of Japanese Yen (JPY) against listed major currencies today. Japanese Yen was the strongest against the Swiss Franc.
| USD | EUR | GBP | JPY | CAD | AUD | NZD | CHF | |
|---|---|---|---|---|---|---|---|---|
| USD | 0.31% | 0.10% | 0.45% | 0.17% | 0.42% | 0.27% | 0.68% | |
| EUR | -0.31% | -0.29% | 0.02% | -0.05% | 0.13% | -0.13% | 0.27% | |
| GBP | -0.10% | 0.29% | 0.31% | 0.09% | 0.45% | 0.19% | 0.53% | |
| JPY | -0.45% | -0.02% | -0.31% | -0.27% | 0.00% | -0.10% | 0.23% | |
| CAD | -0.17% | 0.05% | -0.09% | 0.27% | 0.19% | 0.13% | 0.33% | |
| AUD | -0.42% | -0.13% | -0.45% | -0.00% | -0.19% | -0.14% | 0.22% | |
| NZD | -0.27% | 0.13% | -0.19% | 0.10% | -0.13% | 0.14% | 0.34% | |
| CHF | -0.68% | -0.27% | -0.53% | -0.23% | -0.33% | -0.22% | -0.34% |
The heat map shows percentage changes of major currencies against each other. The base currency is picked from the left column, while the quote currency is picked from the top row. For example, if you pick the Japanese Yen from the left column and move along the horizontal line to the US Dollar, the percentage change displayed in the box will represent JPY (base)/USD (quote).
Recommended Articles


