EUR/GBP Price Analysis: Near-term bias tilts bearish as cross gives up 20-day SMA

Source Fxstreet
  • EUR/GBP remains in a range, unable to establish a clear trend.
  • Bearish divergence in technical indicators points to a shift in momentum.
  • The cross slid below 20-day SMA, but bears need a break below 0.8300 for conviction.

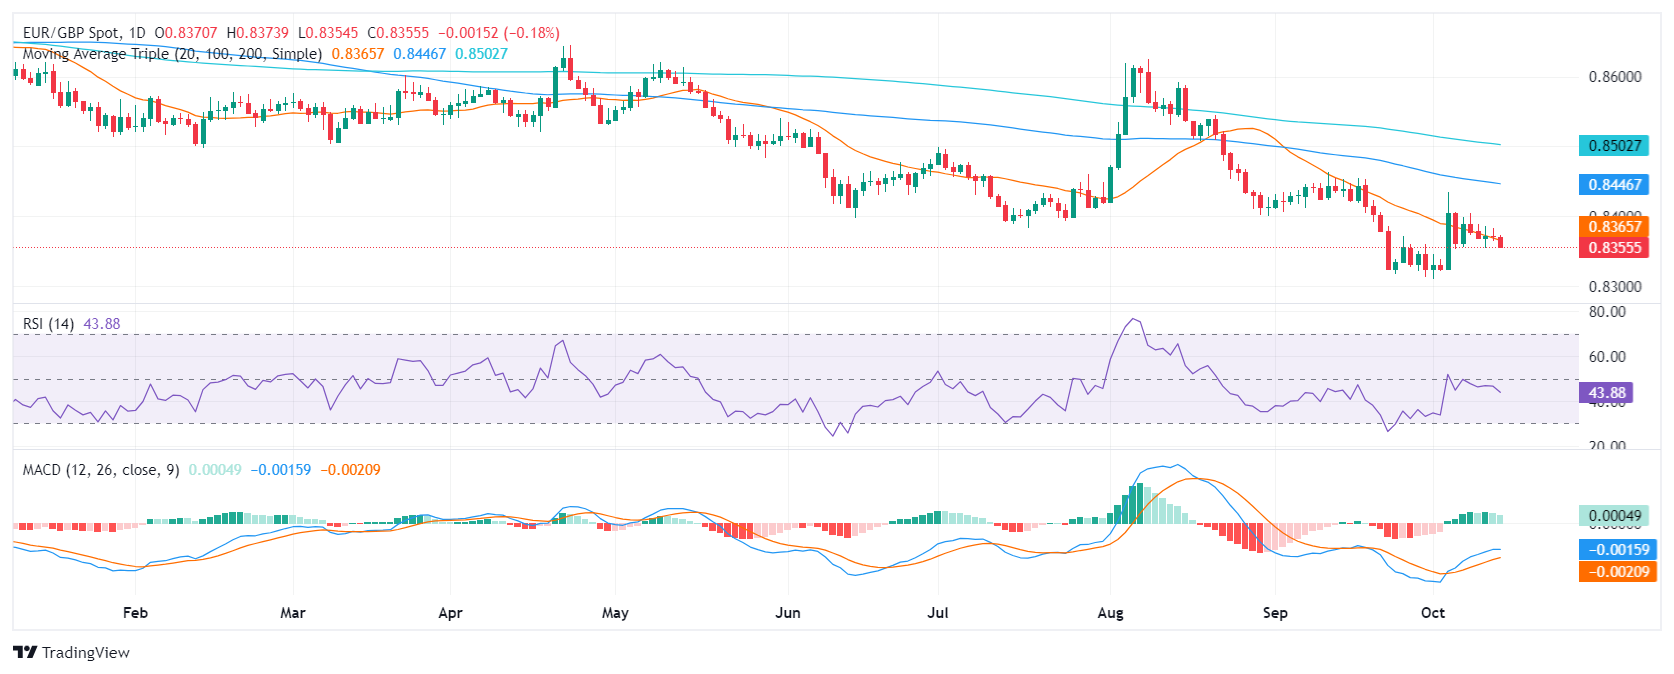
In Monday's session, the EUR/GBP declined and settled lower at around 0.8350, below the 20-day Simple Moving Average (SMA), a development that worsens the technical outlook and reinforce the short-term bearish bias

The EUR/GBP pair has been unable to sustain gains above the 0.8400 resistance level, indicating that the bulls are struggling to regain control. The Relative Strength Index (RSI) is currently at 45, indicating that the pair is in negative territory, below the 50-neutral threshold. Moreover, the RSI's decline suggests that selling pressure is intensifying.

The Moving Average Convergence Divergence (MACD) is also sending bearish signals. The MACD histogram is green and decreasing, indicating that buying pressure is waning.

 Support levels:  0.8320, 0.8300, 0.8280.
Resistance levels:  0.8390, 0.8400, 0.8430.

EUR/GBP daily chart

Disclaimer: For information purposes only. Past performance is not indicative of future results.
placeholder
A Crash After a Surge: Why Silver Lost 40% in a Week?TradingKey - Spot Silver ( XAGUSD) prices have continued to decline; on Thursday, silver plummeted as much as 20% to break below $71 per ounce, and on Friday the sell-off intensified as prices fell fu
Author  TradingKey
Yesterday 10: 23
TradingKey - Spot Silver ( XAGUSD) prices have continued to decline; on Thursday, silver plummeted as much as 20% to break below $71 per ounce, and on Friday the sell-off intensified as prices fell fu
placeholder
Bitcoin is trading around $63,000, down nearly 40% from its peak near $126,000Wall Street desks are no longer talking about upside dreams. The talk right now is how far Bitcoin charts could fall if selling keeps piling up. According to data from TradingView, Bitcoin’s price now sits at a shocking $63,500, after falling from $70,000 just this morning, losing $13,000 in 6 days, and staying far below […]
Author  Cryptopolitan
Yesterday 09: 03
Wall Street desks are no longer talking about upside dreams. The talk right now is how far Bitcoin charts could fall if selling keeps piling up. According to data from TradingView, Bitcoin’s price now sits at a shocking $63,500, after falling from $70,000 just this morning, losing $13,000 in 6 days, and staying far below […]
placeholder
WTI declines below $63.00 as US-Iran talks loom West Texas Intermediate (WTI), the US crude oil benchmark, is trading around $62.85 during the Asian trading hours on Friday. The WTI price declines after the United States (US) and Iran agreed to hold talks in Oman on Friday. 
Author  FXStreet
Yesterday 03: 10
West Texas Intermediate (WTI), the US crude oil benchmark, is trading around $62.85 during the Asian trading hours on Friday. The WTI price declines after the United States (US) and Iran agreed to hold talks in Oman on Friday. 
placeholder
Bitcoin Surrenders $65,000 as Analysts Warn of ‘Structural’ Market BreakBitcoin plunges 11% to break $65k as analysts term the crash "structural," citing a $1 trillion market wipeout and $2.09 billion in daily liquidations.
Author  Mitrade
Yesterday 01: 03
Bitcoin plunges 11% to break $65k as analysts term the crash "structural," citing a $1 trillion market wipeout and $2.09 billion in daily liquidations.
placeholder
Bitcoin Drops to $70,000. U.S. Government Refuses to Bail Out Market, End of Bull Market or Golden Pit? The U.S. government refuses to bail out Bitcoin, and with Fed rate cuts nowhere in sight, a continued downward trend to test for a bottom is likely after a brief rebound.During the mid-da
Author  TradingKey
Feb 05, Thu
The U.S. government refuses to bail out Bitcoin, and with Fed rate cuts nowhere in sight, a continued downward trend to test for a bottom is likely after a brief rebound.During the mid-da
Related Instrument
goTop
quote