

GBP/USD Price Forecast: Falls and consolidates at around 1.3050
- GBP/USD remains in a tight range between 1.3010 and 1.3095, pressured by the 50-DMA at 1.3104 and support at 1.3000.
- Momentum favors sellers, with the RSI in bearish territory, suggesting potential for a lower move toward the 100-DMA at 1.2945.
- A break above 1.3100 could lead to resistance at the October 4 peak of 1.3175, with further gains targeting 1.3200.
The Pound Sterling begins the week on the back foot amid a scarce economic docket on Monday, which will gather traction on Tuesday with the UK’s employment report. At the time of writing, the GBP/USD trades at 1.3046 and loses 0.09% amid thin trading conditions.
GBP/USD Price Forecast: Technical outlook
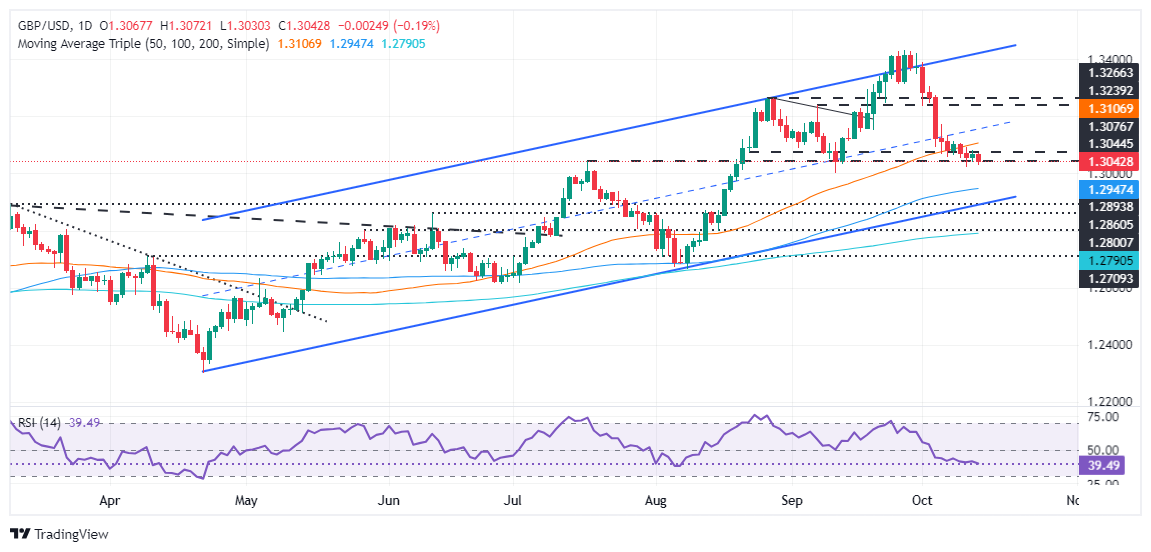
The GBP/USD consolidates for the third straight day within the 1.3010-1.3095 area, unable to crack the top/bottom of the range, capped on the upside by the 50-day moving average (DMA) at 1.3104, and on the downside by the 1.3000 figure.
Momentum shows sellers are in charge, with the Relative Strength Index (RSI) aiming lower and in bearish territory. This suggests the path of least resistance is downward biased, so GBP/USD traders should be wary of the release of crucial UK data.
If GBP/USD drops below 1.3000, the next support would be the 100-DMA at 1.2945, ahead of the 1.2900 figure. Further losses are seen if the major drops below the 200-DMA at 1.2789.
Conversely, if GBP/USD clears the 1.3100 figure, look for the 50-DMA At 1.3104. A breach of the latter will expose the October 4 peak at 1.3175 before challenging 1.3200,
GBP/USD Price Action – Daily Chart
British Pound PRICE Today
The table below shows the percentage change of British Pound (GBP) against listed major currencies today. British Pound was the strongest against the Swiss Franc.
| USD | EUR | GBP | JPY | CAD | AUD | NZD | CHF | |
|---|---|---|---|---|---|---|---|---|
| USD | 0.29% | 0.19% | 0.55% | 0.21% | 0.44% | 0.35% | 0.85% | |
| EUR | -0.29% | -0.18% | 0.18% | -0.00% | 0.17% | -0.04% | 0.46% | |
| GBP | -0.19% | 0.18% | 0.33% | 0.04% | 0.39% | 0.16% | 0.62% | |
| JPY | -0.55% | -0.18% | -0.33% | -0.35% | -0.09% | -0.16% | 0.28% | |
| CAD | -0.21% | 0.00% | -0.04% | 0.35% | 0.18% | 0.16% | 0.47% | |
| AUD | -0.44% | -0.17% | -0.39% | 0.09% | -0.18% | -0.08% | 0.38% | |
| NZD | -0.35% | 0.04% | -0.16% | 0.16% | -0.16% | 0.08% | 0.44% | |
| CHF | -0.85% | -0.46% | -0.62% | -0.28% | -0.47% | -0.38% | -0.44% |
The heat map shows percentage changes of major currencies against each other. The base currency is picked from the left column, while the quote currency is picked from the top row. For example, if you pick the British Pound from the left column and move along the horizontal line to the US Dollar, the percentage change displayed in the box will represent GBP (base)/USD (quote).
Recommended Articles


