

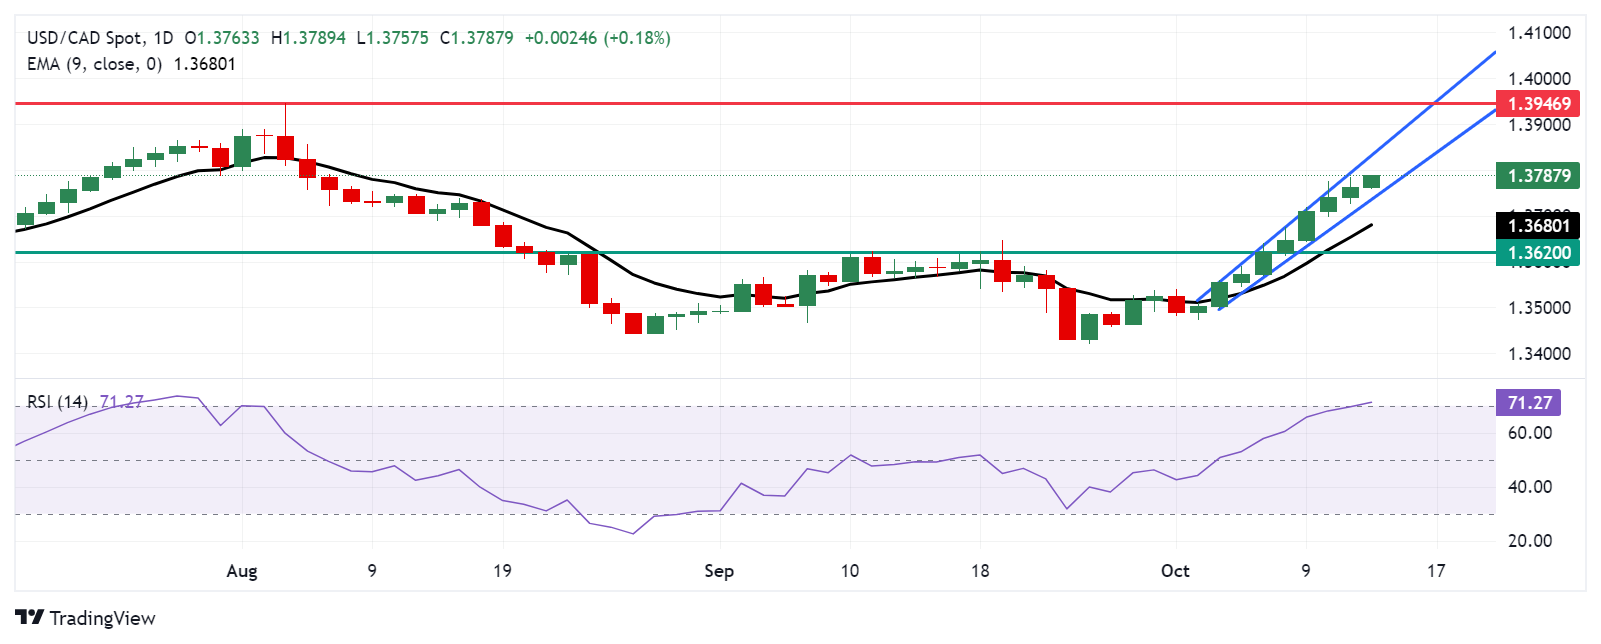
USD/CAD Price Forecast: Rises to near 1.3800, upper boundary of ascending channel
- The USD/CAD pair may test the upper boundary of the ascending channel at the 1.3840 level.
- The 14-day RSI indicates an overbought situation, suggesting a potential downward correction could occur soon.
- The potential support appears at the lower boundary of the ascending channel around the 1.3740 level.
USD/CAD continues its winning streak that began October 2, hovering around 1.3790 during the European trading hours on Monday. The daily chart analysis shows that the pair is moving upwards within the ascending channel, suggesting the strengthening of a bullish bias.
However, the 14-day Relative Strength Index (RSI) is positioned above the 70 level, indicating an overbought situation for the pair and potential downward correction any time soon.
Regarding the upside, the USD/CAD pair could explore the region around the upper boundary of the ascending channel at the 1.3840 level. A break above this level could strengthen the bullish sentiment and support the pair to approach 1.3946, the highest level since October 2022.
On the downside, the USD/CAD may find support at the lower boundary of the ascending channel around the 1.3740 level. A breach below the ascending channel could weaken the bullish sentiment and lead the pair to navigate the area around its nine-day Exponential Moving Average (EMA) at 1.3680 level.
Further support appears at the “pullback resistance turns into throwback support” around the 1.3620 level, followed by the psychological level of 1.3600.
USD/CAD: Daily Chart
Canadian Dollar PRICE Today
The table below shows the percentage change of Canadian Dollar (CAD) against listed major currencies today. Canadian Dollar was the weakest against the British Pound.
| USD | EUR | GBP | JPY | CAD | AUD | NZD | CHF | |
|---|---|---|---|---|---|---|---|---|
| USD | 0.11% | 0.02% | 0.22% | 0.11% | 0.33% | 0.30% | 0.37% | |
| EUR | -0.11% | -0.16% | 0.00% | 0.08% | 0.24% | 0.10% | 0.17% | |
| GBP | -0.02% | 0.16% | 0.16% | 0.12% | 0.43% | 0.29% | 0.31% | |
| JPY | -0.22% | 0.00% | -0.16% | -0.10% | 0.14% | 0.14% | 0.15% | |
| CAD | -0.11% | -0.08% | -0.12% | 0.10% | 0.17% | 0.22% | 0.09% | |
| AUD | -0.33% | -0.24% | -0.43% | -0.14% | -0.17% | -0.01% | 0.00% | |
| NZD | -0.30% | -0.10% | -0.29% | -0.14% | -0.22% | 0.01% | 0.00% | |
| CHF | -0.37% | -0.17% | -0.31% | -0.15% | -0.09% | -0.01% | -0.01% |
The heat map shows percentage changes of major currencies against each other. The base currency is picked from the left column, while the quote currency is picked from the top row. For example, if you pick the Canadian Dollar from the left column and move along the horizontal line to the US Dollar, the percentage change displayed in the box will represent CAD (base)/USD (quote).
Recommended Articles


