

AUD/USD recovers from drop to 0.6575 but still in the red on Tuesday
- AUD/USD fell into familiar lows after a rejection from 0.6625.
- The Aussie found a floor near 0.6575, but upside momentum remains thin.
- Australian CPI inflation in the pipe ahead of Wednesday’s Fed rate call.
AUD/USD is cycling the 0.6600 handle in a rough range as Aussie (AUD) traders gear up for Australian Consumer Price Index (CPI) inflation due during the early Wednesday session ahead of another rate cal from the US Federal Reserve (Fed).
Australia’s fourth-quarter CPI is expected to contract slightly on an annualized basis, with the headline YoY CPI forecast to print at 4.3% versus the previous 5.4% and the QoQ data expected to slip to 0.8% from 1.2%.
On the Fed side, markets are awaiting a pivot from Fed chairman Jerome Powell. Rate swap markets have seen their rate cut bets steadily pushed further out, and the CME’s FedWatch Tool now sees a less than 40% chance of a first rate cut from the Fed in March. Swaps originally priced in an over 80% chance of a March rate trim back in December, but easing inflation and stubbornly strong economic data from the US over the last quarter renders a rate cut from the Fed next to impossible for fear of re-stoking inflationary pressure.
The back half of the trading week will cap off with China’s Caixin Manufacturing Purchasing Managers’ Index (PMI) figure expected to tick down slightly from 50.8 to 50.6, and broader markets will be looking for a softer print in Friday’s US Nonfarm Payrolls. Friday’s NFP is forecast to tick down to 180K for January from December’s 216K.
AUD/USD technical outlook
The AUD/USD reclaimed the 0.6600 handle on Tuesday after a near-term dip into 0.6575, and the pair is catching intraday technical support from the 200-hour Simple Moving Average (SMA) near 0.6590.
The Aussie continues to catch technical support from the 200-day SMA just above 0.6550 on the daily candlesticks. The pair is still caught in a congestion pattern below the 50-day SMA just above 0.6650.
AUD/USD hourly chart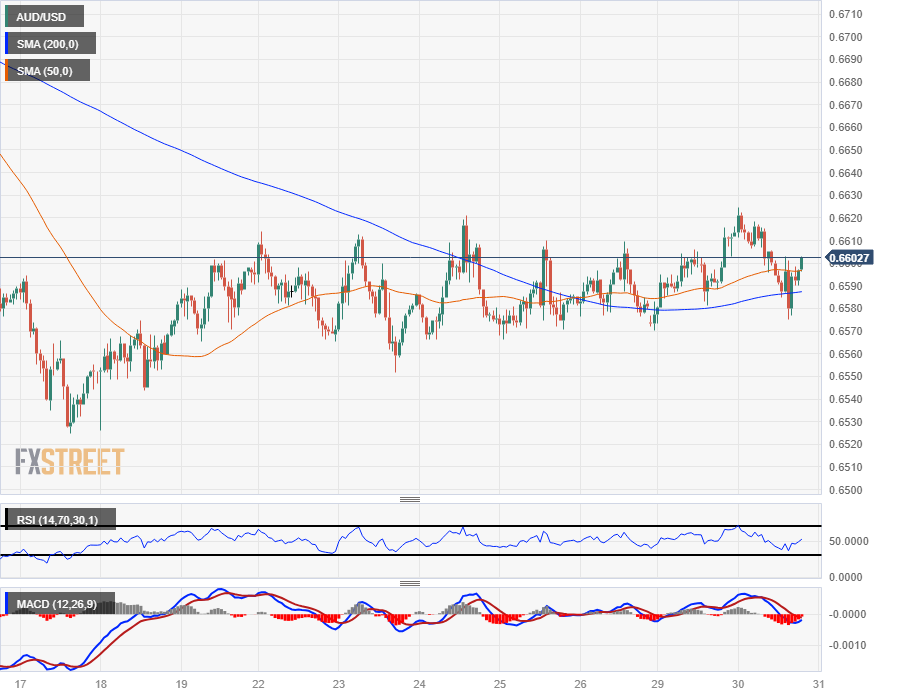
AUD/USD daily chart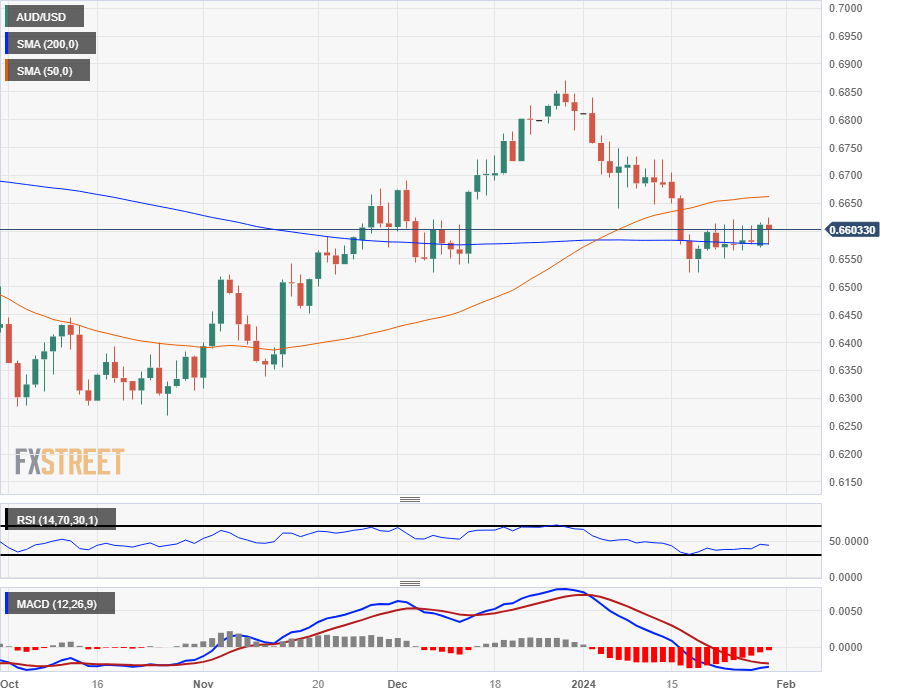
Recommended Articles


