USD/CAD Price Forecast: Establishes new uptrend after sudden reversal

Source Fxstreet
  • USD/CAD is unfolding a bullish move higher within a longer-term range. 
  • The short-term trend is now bullish, favoring more upside eventually. 

USD/CAD was declining within its longer-term range until it bottomed out on September 25 and began rising. 

What started out looking like a correction of the downmove has since morphed into a full blown bullish reversal and the start of a new leg higher within the range. 

USD/CAD Daily Chart 

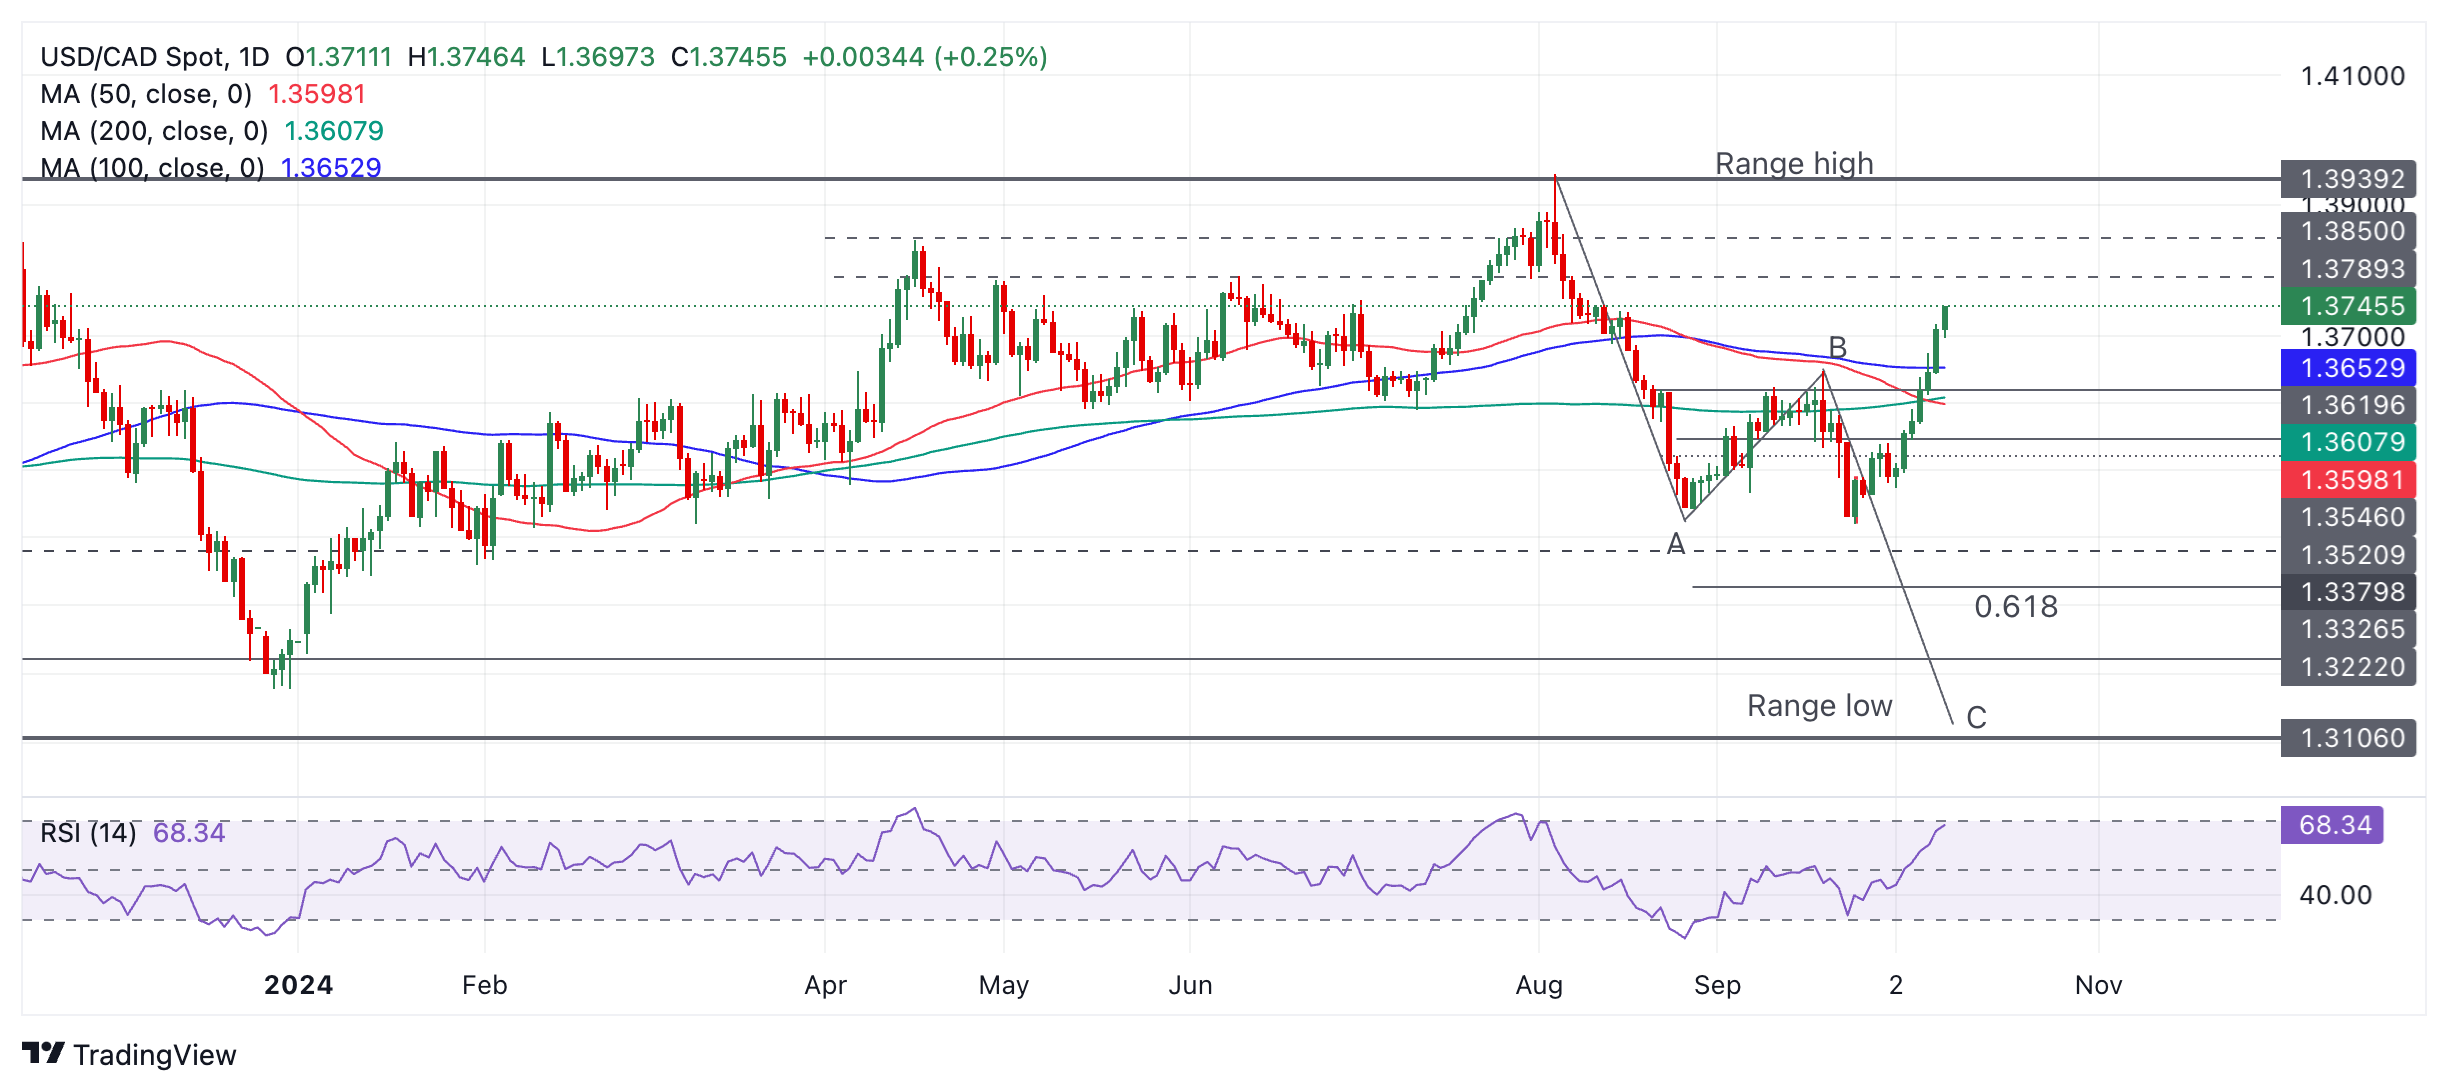
The short-term trend is now bullish and given the old saying that “the trend is your friend” the odds favor a continuation higher. 

The next target to the upside lies at resistance from multiple market tops at around 1.3789. A break above that could see prices push further up to 1.3850. It would be wise to wait for a pullback before any aggressive buying. The support zone between 1.3650 and 1.3670 might be a good place to enter longs. 

The Relative Strength Index (RSI) is at 68.34 which is almost in the overbought zone above 70. If it moves into overbought it will be a signal not to add to long positions. 

USD/CAD had been unfolding what looked like an ABC pattern or Measured Move during August and most of September (see chart). The pattern generated downside targets near the base of the range. 

However, price action since has proven this interpretation wrong, invalidating the bearish forecast.


Disclaimer: For information purposes only. Past performance is not indicative of future results.
placeholder
Bitcoin Suffers Year’s Strongest Waterfall-Style Decline. Will It Next Drop to the $60,000 Mark?During the Asian trading session on June 4, Bitcoin continued its multi-day slump, briefly dropping below the $62,000 mark to $61,338. As of press time, Bitcoin was trading at $63,844, wi
Author  TradingKey
10 hours ago
During the Asian trading session on June 4, Bitcoin continued its multi-day slump, briefly dropping below the $62,000 mark to $61,338. As of press time, Bitcoin was trading at $63,844, wi
placeholder
Bitcoin drops below $65K amid reinforced bear market signalsBitcoin (BTC) dipped further below $65,000 on Wednesday, with onchain data from Glassnode signaling a market firmly in a bear phase. The decline has pushed prices back into a key valuation range between the Realized Price and the True Market Mean.
Author  FXStreet
19 hours ago
Bitcoin (BTC) dipped further below $65,000 on Wednesday, with onchain data from Glassnode signaling a market firmly in a bear phase. The decline has pushed prices back into a key valuation range between the Realized Price and the True Market Mean.
placeholder
Forex Today: US Dollar stays resilient ahead of key US dataHere is what you need to know on Wednesday, June 3:
Author  FXStreet
Yesterday 10: 27
Here is what you need to know on Wednesday, June 3:
placeholder
$1.5 Billion in Crypto Assets Liquidated, Bitcoin Falls Below $66,000 Mark. What Is the Reason?On June 2, Eastern Time, the cryptocurrency market suffered its most severe wave of concentrated liquidations so far this year. Bitcoin ( BTC) fell below the $70,000 psychological support
Author  TradingKey
Yesterday 06: 32
On June 2, Eastern Time, the cryptocurrency market suffered its most severe wave of concentrated liquidations so far this year. Bitcoin ( BTC) fell below the $70,000 psychological support
placeholder
WTI rises to near $93.00 as Iran launches missiles toward Kuwait, BahrainWest Texas Intermediate (WTI) gains ground for the third successive day, trading around $92.90 per barrel during the Asian hours on Wednesday.
Author  FXStreet
Yesterday 01: 24
West Texas Intermediate (WTI) gains ground for the third successive day, trading around $92.90 per barrel during the Asian hours on Wednesday.
Related Instrument
goTop
quote