


AUD/USD Price Analysis: Retreat from 0.6740 amid caution ahead of US Inflation
- AUD/USD retreats from 0.6740 as traders brace for the US inflation data for September.
- The US inflation data will influence the Fed's likely interest rate action in the remainder of the year.
- Australia’s Consumer Inflation Expectations decelerated to 4% in October.
The AUD/USD pair falls back after a short-lived pullback to near 0.6740 in Thursday’s European session. The Aussie pair faces pressure as the market sentiment turn cautious ahead of the United States (US) Consumer Price Index (CPI) data for September, which is scheduled at 12:30 GMT.
S&P 500 futures have posted some losses in European trading hours, exhibiting a risk-aversion mood. The US Dollar Index (DXY), which gauges the Greenback’s value against six major currencies, holds onto gains near the seven-week high of 103.00.
Economists expect the headline CPI to have grown at a slower pace of 2.3% against 2.5% in August, with the core CPI – which excludes volatile food and energy prices – rising steadily by 3.2%.
Investors will pay close attention to the US inflation data for fresh cues about the Federal Reserve’s (Fed) interest rate outlook for the remaining year.
In the Asia-Pacific region, the Melbourne Institute has reported that one-year forward Consumer Inflation Expectations for October has softened significantly to 4% from 4.4% in September. Investors will focus on how soft inflation expectations will influence market expectations for Reserve Bank of Australia’s (RBA) likely policy action in the last quarter of the year. Currently, traders expect the RBA to leave its Official Cash Rate (OCR) at 4.35% by the year-end.
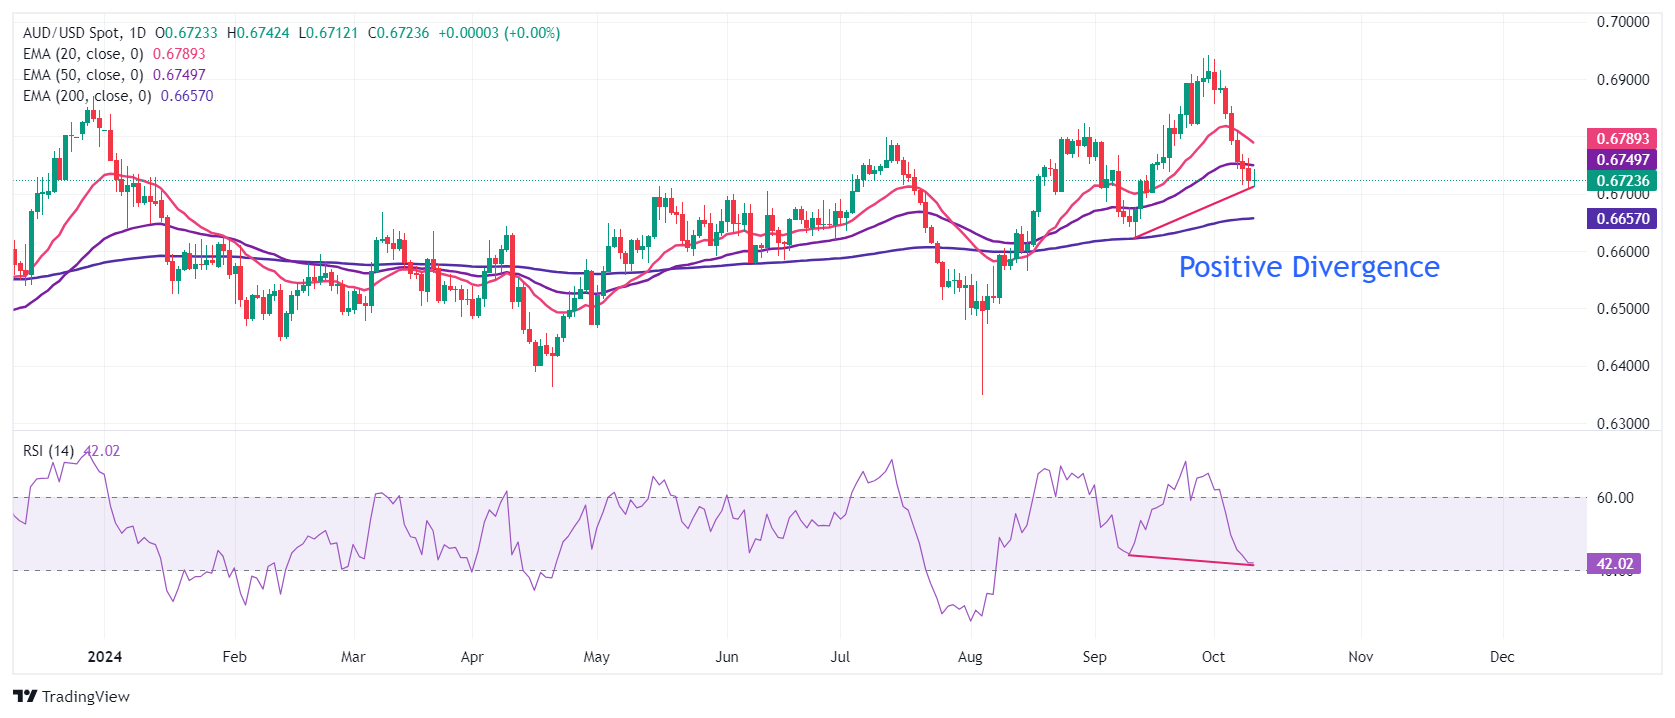
AUD/USD strives to end its losing streak on Thursday. The near-term outlook of the Aussie pair is uncertain as it has declined below the 20-and 50-day Exponential Moving Averages (EMAs), which trade around 0.6790 and 0.6750, respectively.
However, there is a slight chance of a bullish reversal due to a Positive Divergence formation, shown by the 14-day Relative Strength Index (RSI). The momentum oscillator has made a lower low while the higher low pattern in the asset is intact, suggesting an oversold situation in an uptrend.
A decisive recovery move above the 20-day EMA near 0.6790 could push the asset towards October 4 high of 0.6850, followed by October 3 high of 0.6888.
In an alternate scenario, the pair could witness more downside towards the 200-day EMA near 0.6660 and the August 12 high of 0.6605 if it breaks below the round-level support of 0.6700.
AUD/USD daily chart
Australian Dollar FAQs
One of the most significant factors for the Australian Dollar (AUD) is the level of interest rates set by the Reserve Bank of Australia (RBA). Because Australia is a resource-rich country another key driver is the price of its biggest export, Iron Ore. The health of the Chinese economy, its largest trading partner, is a factor, as well as inflation in Australia, its growth rate and Trade Balance. Market sentiment – whether investors are taking on more risky assets (risk-on) or seeking safe-havens (risk-off) – is also a factor, with risk-on positive for AUD.
The Reserve Bank of Australia (RBA) influences the Australian Dollar (AUD) by setting the level of interest rates that Australian banks can lend to each other. This influences the level of interest rates in the economy as a whole. The main goal of the RBA is to maintain a stable inflation rate of 2-3% by adjusting interest rates up or down. Relatively high interest rates compared to other major central banks support the AUD, and the opposite for relatively low. The RBA can also use quantitative easing and tightening to influence credit conditions, with the former AUD-negative and the latter AUD-positive.
China is Australia’s largest trading partner so the health of the Chinese economy is a major influence on the value of the Australian Dollar (AUD). When the Chinese economy is doing well it purchases more raw materials, goods and services from Australia, lifting demand for the AUD, and pushing up its value. The opposite is the case when the Chinese economy is not growing as fast as expected. Positive or negative surprises in Chinese growth data, therefore, often have a direct impact on the Australian Dollar and its pairs.
Iron Ore is Australia’s largest export, accounting for $118 billion a year according to data from 2021, with China as its primary destination. The price of Iron Ore, therefore, can be a driver of the Australian Dollar. Generally, if the price of Iron Ore rises, AUD also goes up, as aggregate demand for the currency increases. The opposite is the case if the price of Iron Ore falls. Higher Iron Ore prices also tend to result in a greater likelihood of a positive Trade Balance for Australia, which is also positive of the AUD.
The Trade Balance, which is the difference between what a country earns from its exports versus what it pays for its imports, is another factor that can influence the value of the Australian Dollar. If Australia produces highly sought after exports, then its currency will gain in value purely from the surplus demand created from foreign buyers seeking to purchase its exports versus what it spends to purchase imports. Therefore, a positive net Trade Balance strengthens the AUD, with the opposite effect if the Trade Balance is negative.
Recommended Articles


